Publication
Metrics
AI Quick Summary
This research develops a machine learning framework to automatically identify telescope usage in astrophysics publications, addressing the limitations of manual classification. The framework uses keyword identification, text transformation, and SVM classification to achieve 92.9% accuracy in tracking facility usage, proving robust and adaptable for global observatories.
Paper Preview
Abstract
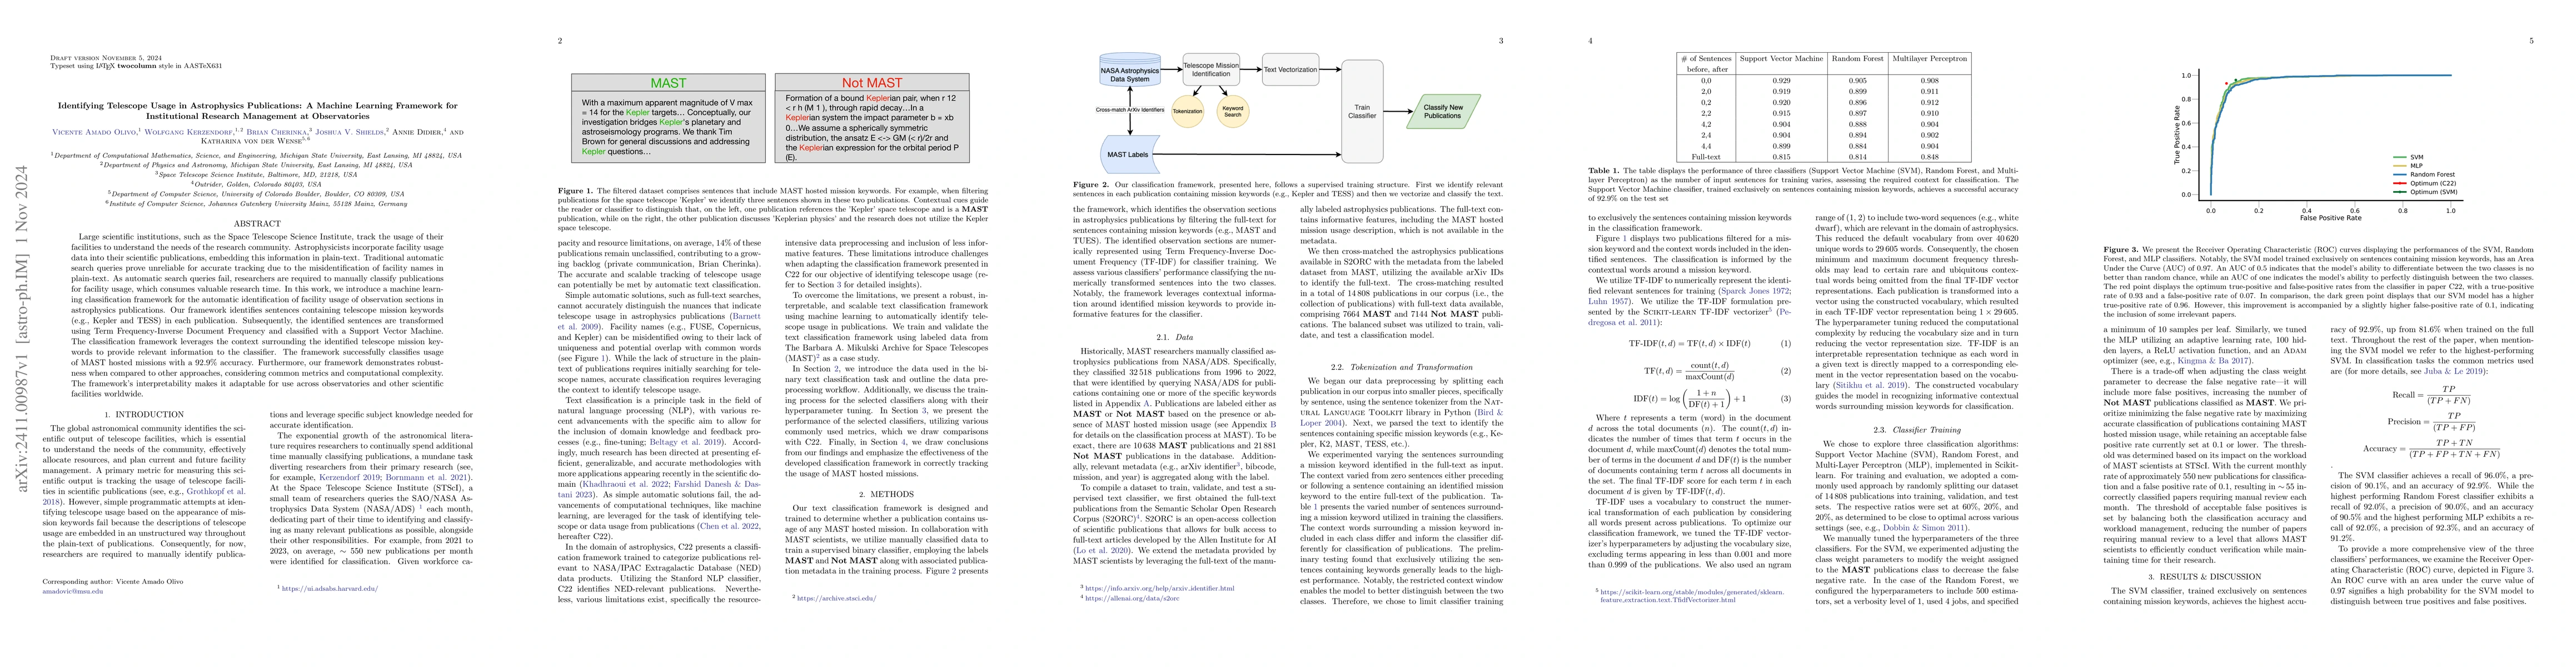
Large scientific institutions, such as the Space Telescope Science Institute, track the usage of their facilities to understand the needs of the research community. Astrophysicists incorporate facility usage data into their scientific publications, embedding this information in plain-text. Traditional automatic search queries prove unreliable for accurate tracking due to the misidentification of facility names in plain-text. As automatic search queries fail, researchers are required to manually classify publications for facility usage, which consumes valuable research time. In this work, we introduce a machine learning classification framework for the automatic identification of facility usage of observation sections in astrophysics publications. Our framework identifies sentences containing telescope mission keywords (e.g., Kepler and TESS) in each publication. Subsequently, the identified sentences are transformed using Term Frequency-Inverse Document Frequency and classified with a Support Vector Machine. The classification framework leverages the context surrounding the identified telescope mission keywords to provide relevant information to the classifier. The framework successfully classifies usage of MAST hosted missions with a 92.9% accuracy. Furthermore, our framework demonstrates robustness when compared to other approaches, considering common metrics and computational complexity. The framework's interpretability makes it adaptable for use across observatories and other scientific facilities worldwide.
AI Key Findings
Get AI-generated insights about this paper's methodology, results, significance, and more — seven facets brought into focus.
Impact
Paper Details
Authors
PDF Preview
Citation Network
Current paper (gray), citations (green), references (blue)
Display is limited for performance on very large graphs.
Discussion 0