Summary
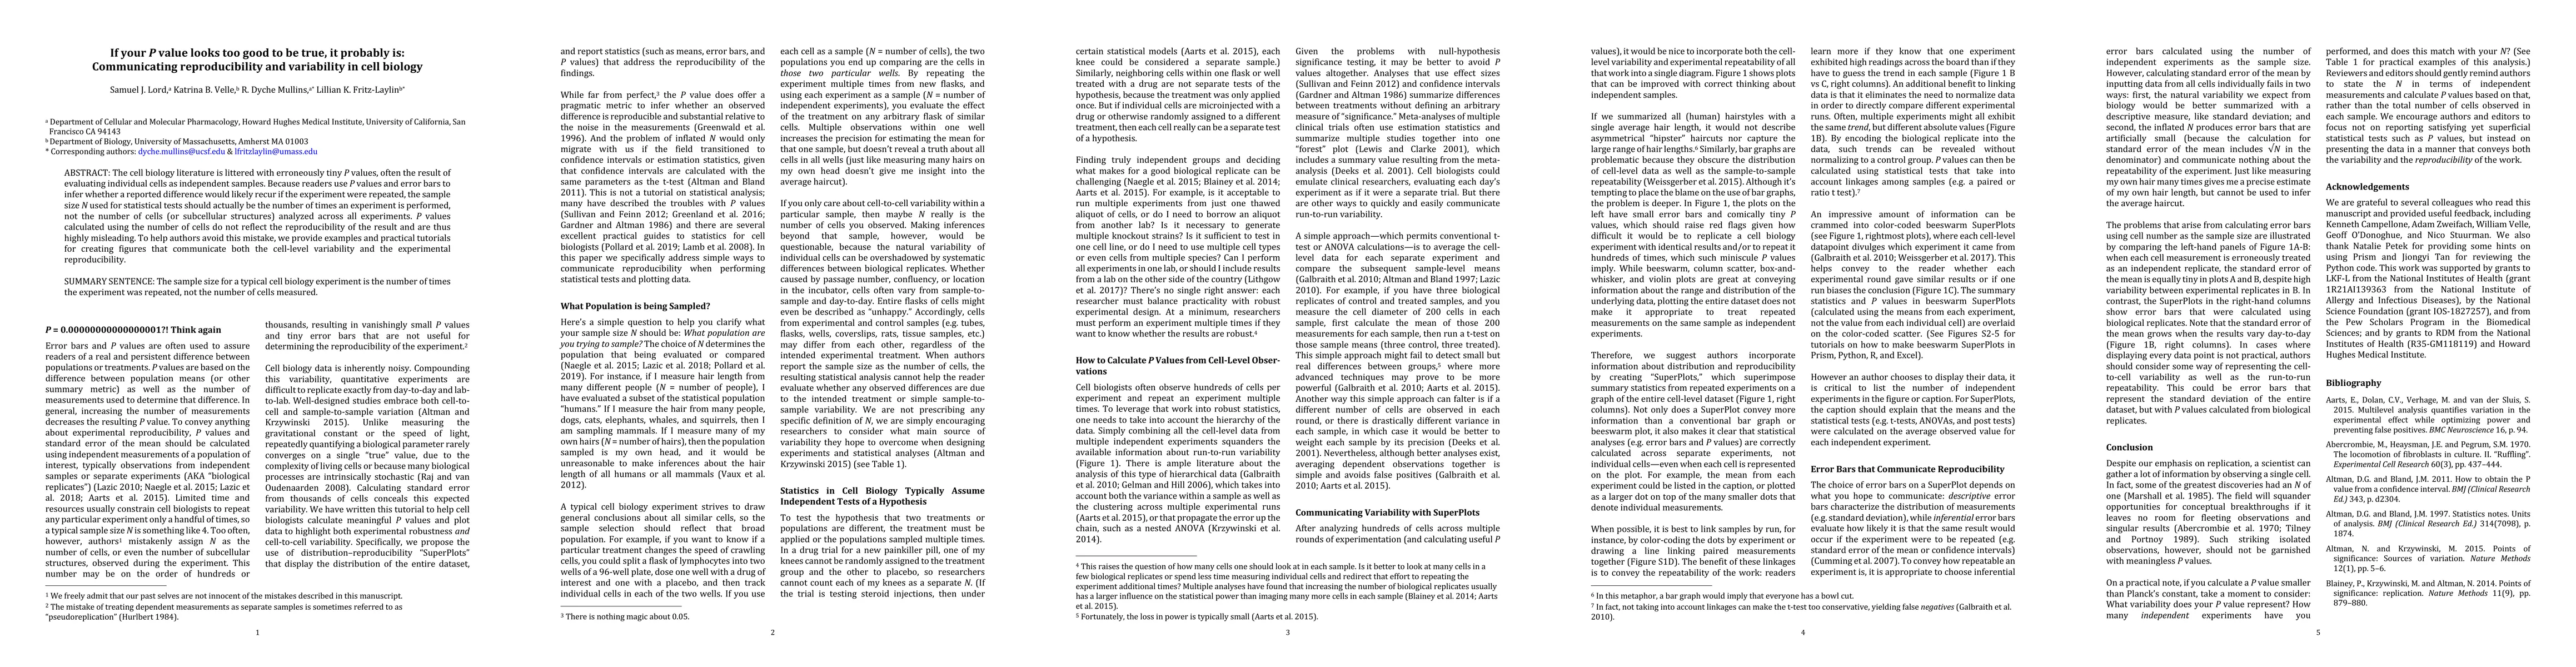
The cell biology literature is littered with erroneously tiny P values, often the result of evaluating individual cells as independent samples. Because readers use P values and error bars to infer whether a reported difference would likely recur if the experiment were repeated, the sample size N used for statistical tests should actually be the number of times an experiment is performed, not the number of cells (or subcellular structures) analyzed across all experiments. P values calculated using the number of cells do not reflect the reproducibility of the result and are thus highly misleading. To help authors avoid this mistake, we provide examples and practical tutorials for creating figures that communicate both the cell-level variability and the experimental reproducibility.
AI Key Findings
Get AI-generated insights about this paper's methodology, results, and significance.
Paper Details
PDF Preview
Key Terms
Citation Network
Current paper (gray), citations (green), references (blue)
Display is limited for performance on very large graphs.
Similar Papers
Found 4 papersQuantity vs. Quality of Monolingual Source Data in Automatic Text Translation: Can It Be Too Little If It Is Too Good?
Shamsuddeen Hassan Muhammad, Idris Abdulmumin, Bashir Shehu Galadanci et al.
| Title | Authors | Year | Actions |
|---|
Comments (0)