Summary
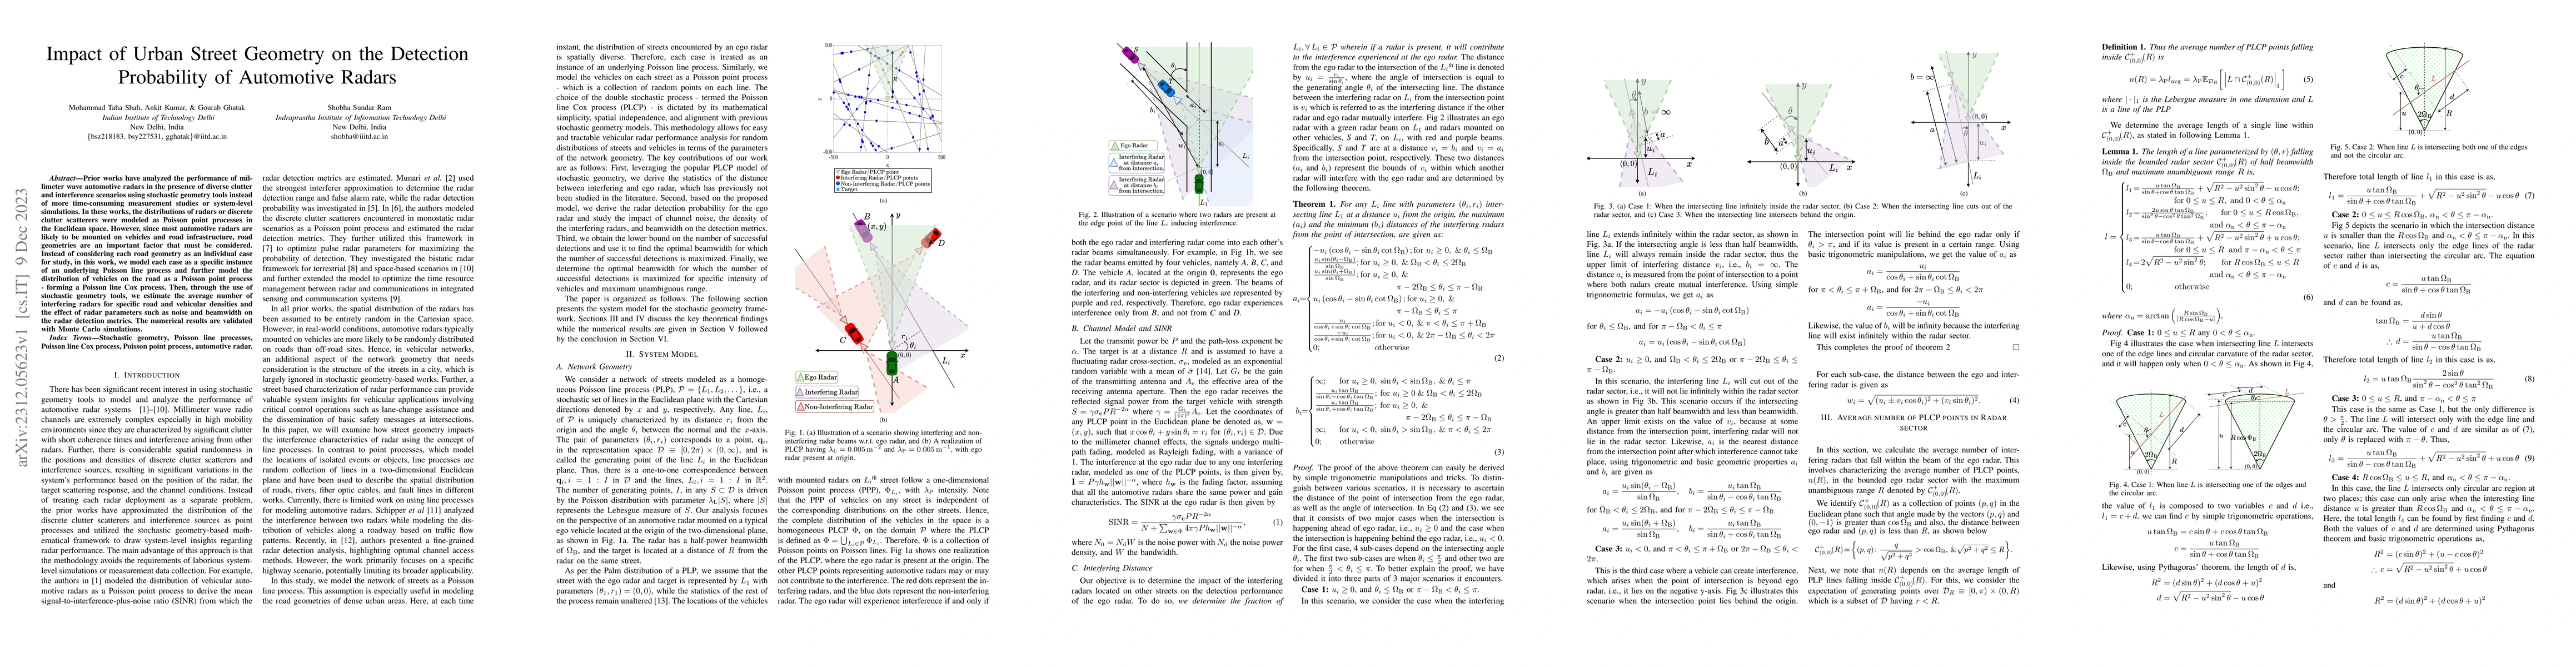
Prior works have analyzed the performance of millimeter wave automotive radars in the presence of diverse clutter and interference scenarios using stochastic geometry tools instead of more time-consuming measurement studies or system-level simulations. In these works, the distributions of radars or discrete clutter scatterers were modeled as Poisson point processes in the Euclidean space. However, since most automotive radars are likely to be mounted on vehicles and road infrastructure, road geometries are an important factor that must be considered. Instead of considering each road geometry as an individual case for study, in this work, we model each case as a specific instance of an underlying Poisson line process and further model the distribution of vehicles on the road as a Poisson point process - forming a Poisson line Cox process. Then, through the use of stochastic geometry tools, we estimate the average number of interfering radars for specific road and vehicular densities and the effect of radar parameters such as noise and beamwidth on the radar detection metrics. The numerical results are validated with Monte Carlo simulations.
AI Key Findings
Get AI-generated insights about this paper's methodology, results, and significance.
Paper Details
PDF Preview
Key Terms
Citation Network
Current paper (gray), citations (green), references (blue)
Display is limited for performance on very large graphs.
Similar Papers
Found 4 papersNo citations found for this paper.
Comments (0)