Improved spread-location visualization
Publication
Metrics
Paper Preview
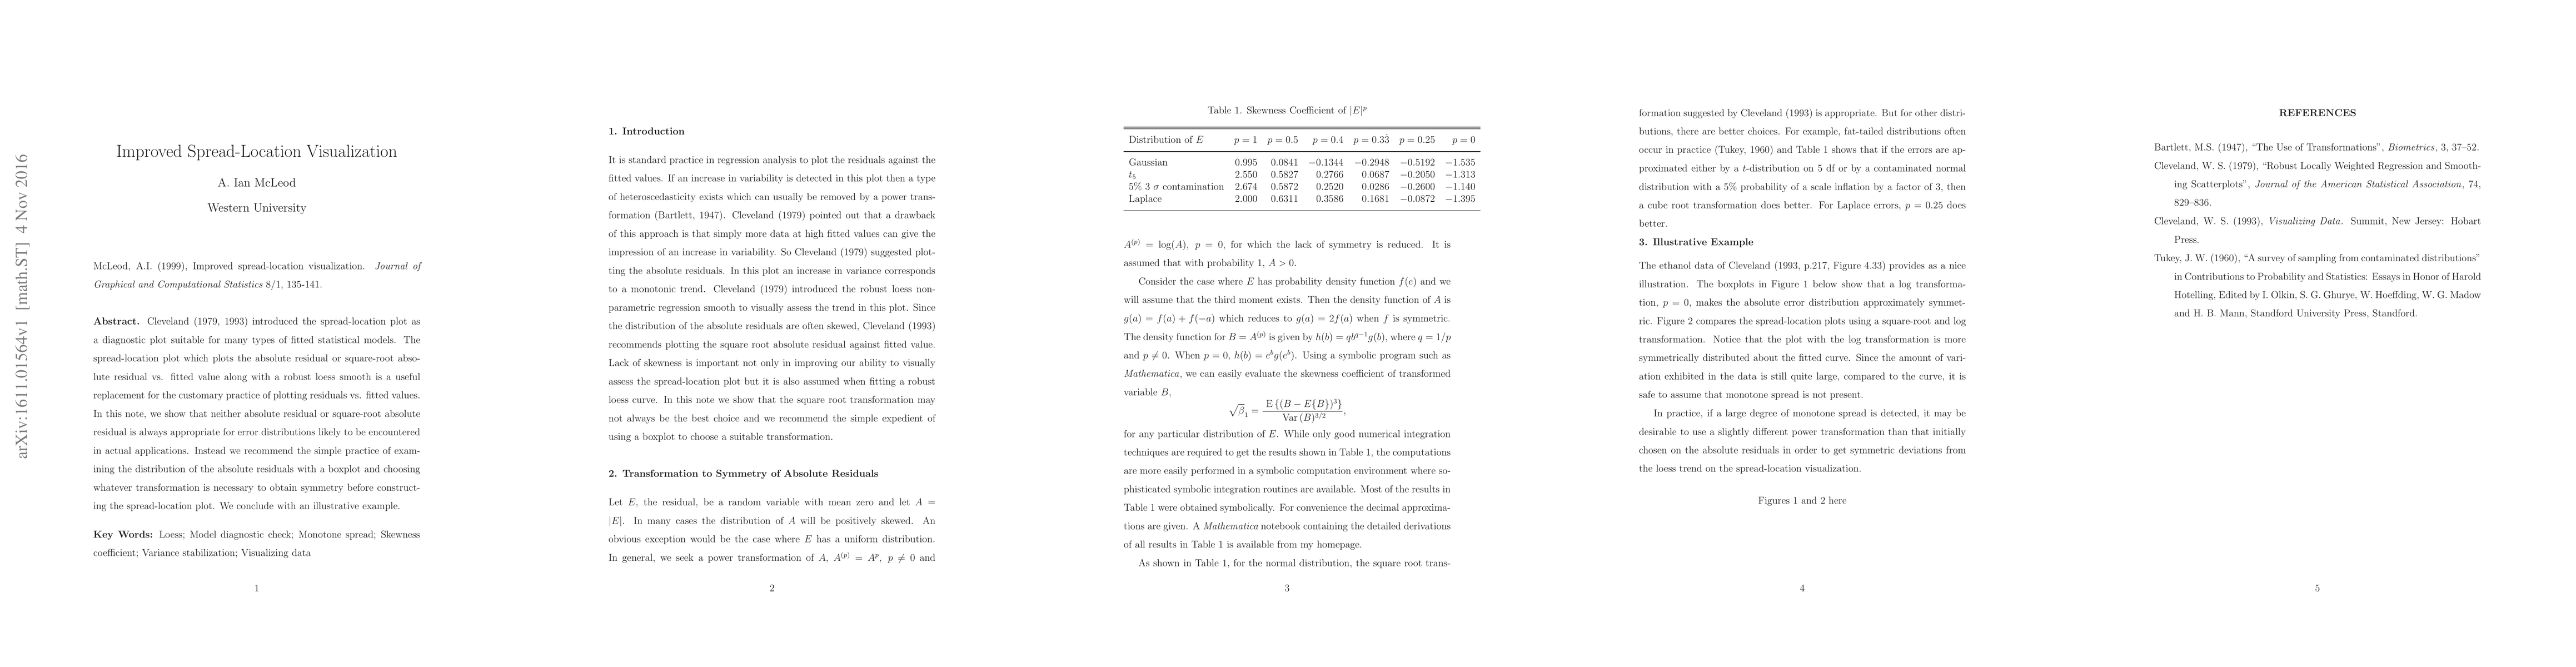
Abstract
The spread-location plot has often been used as a diagnostic plot suitable for many types of fitted statistical models. The spread-location plot which plots the absolute residual or square-root absolute residual versus fitted value along with a robust loess smooth is a useful replacement for the customary practice of plotting residuals versus fitted values. In this note, we show that neither absolute residual or square-root absolute residual is always appropriate for error distributions likely to be encountered in actual applications. Hence we recommend a multipanel display showing a suitable transformation of the absolute residual versus fitted value along with a boxplot to judge the symmetry achieved by the transformation. We conclude with an illustrative example.
AI Key Findings
Get AI-generated insights about this paper's methodology, results, significance, and more — seven facets brought into focus.
Impact
Paper Details
PDF Preview
Key Terms
Citation Network
Current paper (gray), citations (green), references (blue)
Display is limited for performance on very large graphs.
Discussion 0