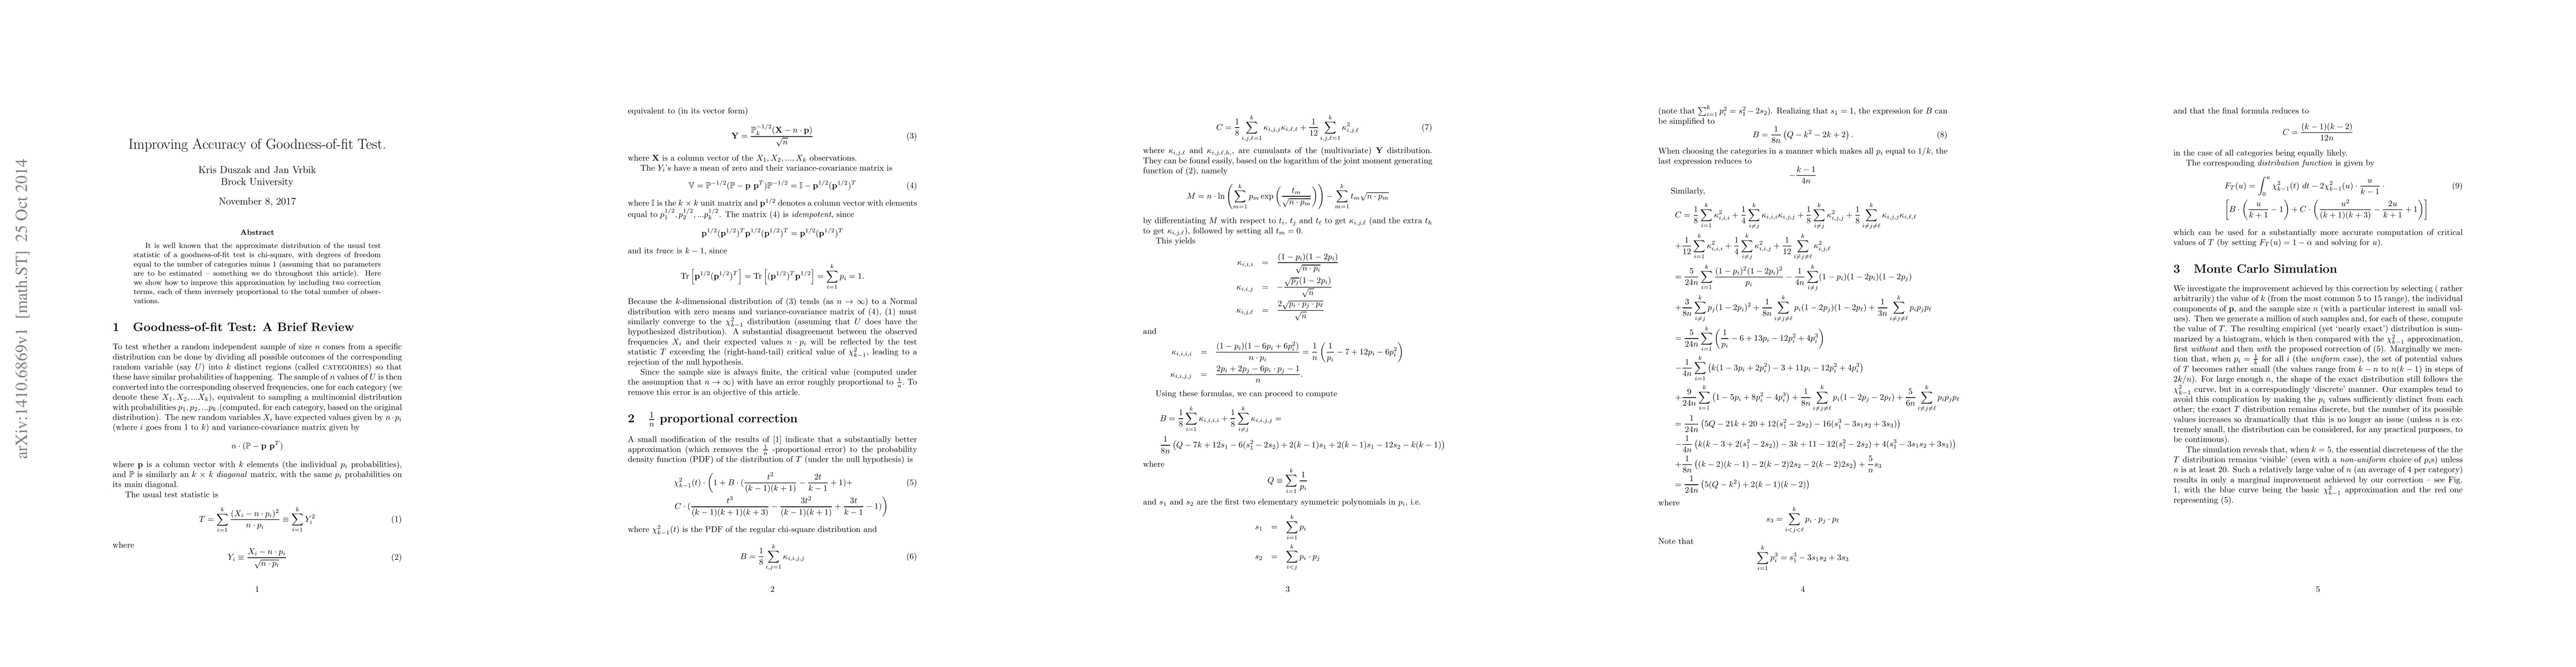
The research introduces correction terms to improve the approximation of the goodness-of-fit test statistic's distribution, which is traditionally assumed to follow a chi-square distribution with degrees of freedom equal to the number of categories minus 1. The correction terms are inversely proportional to the total number of observations and are derived from cumulants of the multivariate Y distribution.
Publication
Metrics
AI Quick Summary
This paper proposes a method to enhance the accuracy of the goodness-of-fit test by incorporating two correction terms, each inversely proportional to the total number of observations, to improve the chi-square approximation.
Quick Answers
What methodology did the authors use?
The research introduces correction terms to improve the approximation of the goodness-of-fit test statistic's distribution, which is traditionally assumed to follow a chi-square distribution with degrees of freedom equal to the number of categories minus 1. The correction terms are inversely proportional to the total number of observations and are derived from cumulants of the multivariate Y distribution. More in Methodology →
What are the key results?
The proposed correction terms, B and C, enhance the accuracy of the goodness-of-fit test by accounting for the total number of observations. — Monte Carlo simulations demonstrate that the new formula provides a more accurate computation of critical values for the test, especially for smaller sample sizes and non-uniform category probabilities. More in Key Results →
Why is this work significant?
This research is significant as it addresses the limitations of the traditional chi-square approximation for the goodness-of-fit test, particularly for smaller sample sizes and non-uniform category probabilities. The improved accuracy can lead to more reliable statistical inference in various fields, including social sciences, biology, and engineering, where goodness-of-fit tests are frequently applied. More in Significance →
What are the main limitations?
The method's effectiveness is contingent on the total number of observations and the chosen category probabilities. — For extremely small sample sizes, even with the correction, the approximation may still show visible errors. More in Limitations →
Abstract
It is well known that the approximate distribution of the usual test statistic of a goodness-of-fit test is chi-square, with degrees of freedom equal to the number of categories minus 1 (assuming that no parameters are to be estimated -- something we do throughout this article). Here we show how to improve this approximation by including two correction terms, each of them inversely proportional to the total number of observations.
Key Findings, in focus
Seven facets of this paper, analysed and brought into focus by AI.
This research is significant as it addresses the limitations of the traditional chi-square approximation for the goodness-of-fit test, particularly for smaller sample sizes and non-uniform category probabilities.
- The proposed correction terms, B and C, enhance the accuracy of the goodness-of-fit test by accounting for the total number of observations.
- Monte Carlo simulations demonstrate that the new formula provides a more accurate computation of critical values for the test, especially for smaller sample sizes and non-uniform category probabilities.
- The correction terms significantly improve the approximation when the number of categories (k) is in the 5-15 range and for diverse category probabilities.
- The new method becomes increasingly accurate as the sample size (n) increases, with noticeable improvements observed for n ≥ 20 when k = 5 and n ≥ 10 when k = 10.
- For very small sample sizes, even with the correction, the approximation may show visible errors, necessitating careful consideration of the values of B and C.
This research is significant as it addresses the limitations of the traditional chi-square approximation for the goodness-of-fit test, particularly for smaller sample sizes and non-uniform category probabilities. The improved accuracy can lead to more reliable statistical inference in various fields, including social sciences, biology, and engineering, where goodness-of-fit tests are frequently applied.
The paper presents a novel approach to refine the approximation of the goodness-of-fit test statistic's distribution by incorporating correction terms B and C, which are derived from cumulants of the multivariate Y distribution and inversely proportional to the total number of observations.
This work distinguishes itself from existing research by providing a more accurate approximation for the goodness-of-fit test statistic's distribution, especially for smaller sample sizes and non-uniform category probabilities. The proposed correction terms, B and C, offer a technical advancement in statistical inference, addressing a long-standing limitation of the traditional chi-square approximation.
- The method's effectiveness is contingent on the total number of observations and the chosen category probabilities.
- For extremely small sample sizes, even with the correction, the approximation may still show visible errors.
- The calculations involve complex formulas for B and C, which may be computationally intensive for large datasets.
- Investigate the performance of the correction terms for an even wider range of k values, possibly extending beyond 15.
- Explore the application of the method in specific domains, such as genetics or finance, where goodness-of-fit tests are crucial but often face challenges with small sample sizes and non-uniform category probabilities.
Impact
Paper Details
PDF Preview
Key Terms
Citation Network
Current paper (gray), citations (green), references (blue)
Display is limited for performance on very large graphs.
Discussion 0