Publication
Metrics
AI Quick Summary
This paper introduces a novel visualization technique using counterfactuals to reveal confounding variables in high-dimensional data analysis, implemented in CoFact. A user study showed that this approach helps users make more accurate judgments about feature relationships.
Paper Preview
Abstract
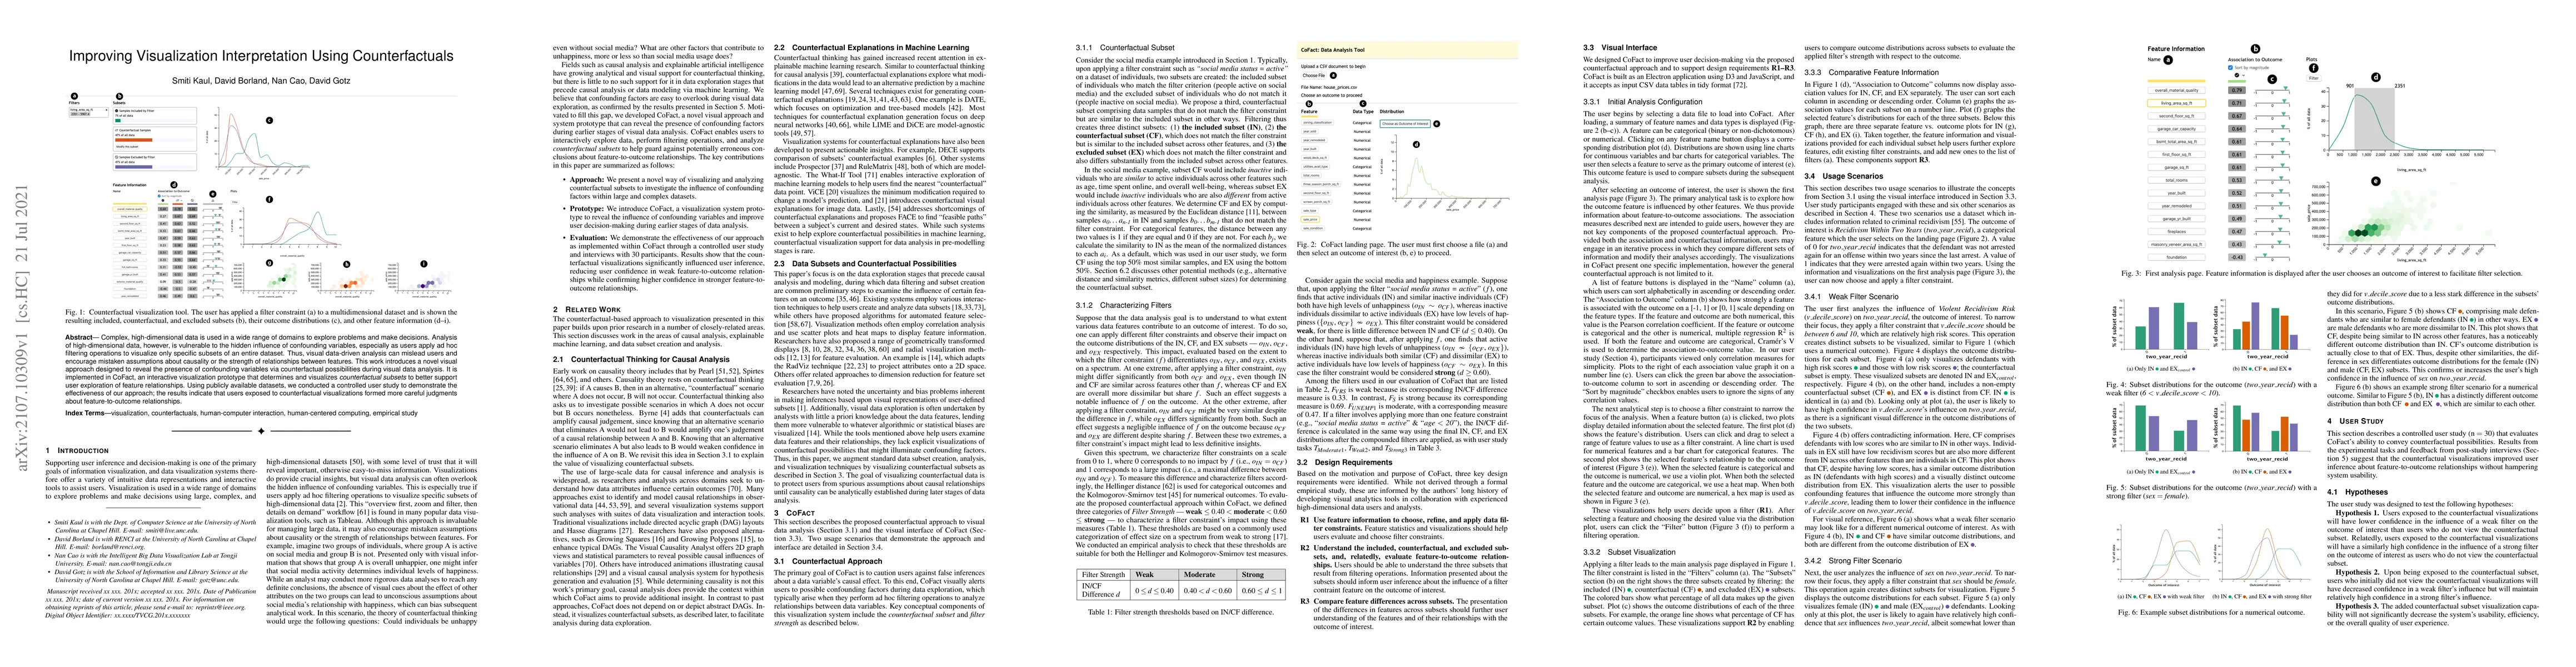
Complex, high-dimensional data is used in a wide range of domains to explore problems and make decisions. Analysis of high-dimensional data, however, is vulnerable to the hidden influence of confounding variables, especially as users apply ad hoc filtering operations to visualize only specific subsets of an entire dataset. Thus, visual data-driven analysis can mislead users and encourage mistaken assumptions about causality or the strength of relationships between features. This work introduces a novel visual approach designed to reveal the presence of confounding variables via counterfactual possibilities during visual data analysis. It is implemented in CoFact, an interactive visualization prototype that determines and visualizes \textit{counterfactual subsets} to better support user exploration of feature relationships. Using publicly available datasets, we conducted a controlled user study to demonstrate the effectiveness of our approach; the results indicate that users exposed to counterfactual visualizations formed more careful judgments about feature-to-outcome relationships.
AI Key Findings
Get AI-generated insights about this paper's methodology, results, significance, and more — seven facets brought into focus.
Impact
Paper Details
Authors
PDF Preview
Key Terms
Citation Network
Current paper (gray), citations (green), references (blue)
Display is limited for performance on very large graphs.
Discussion 0