Incorporating interactive 3-dimensional graphics in astronomy research papers
Publication
Metrics
AI Quick Summary
Researchers have developed a way to embed 3D visualizations of astronomy data into electronic research papers, allowing readers to interactively explore complex data structures.
Paper Preview
Abstract
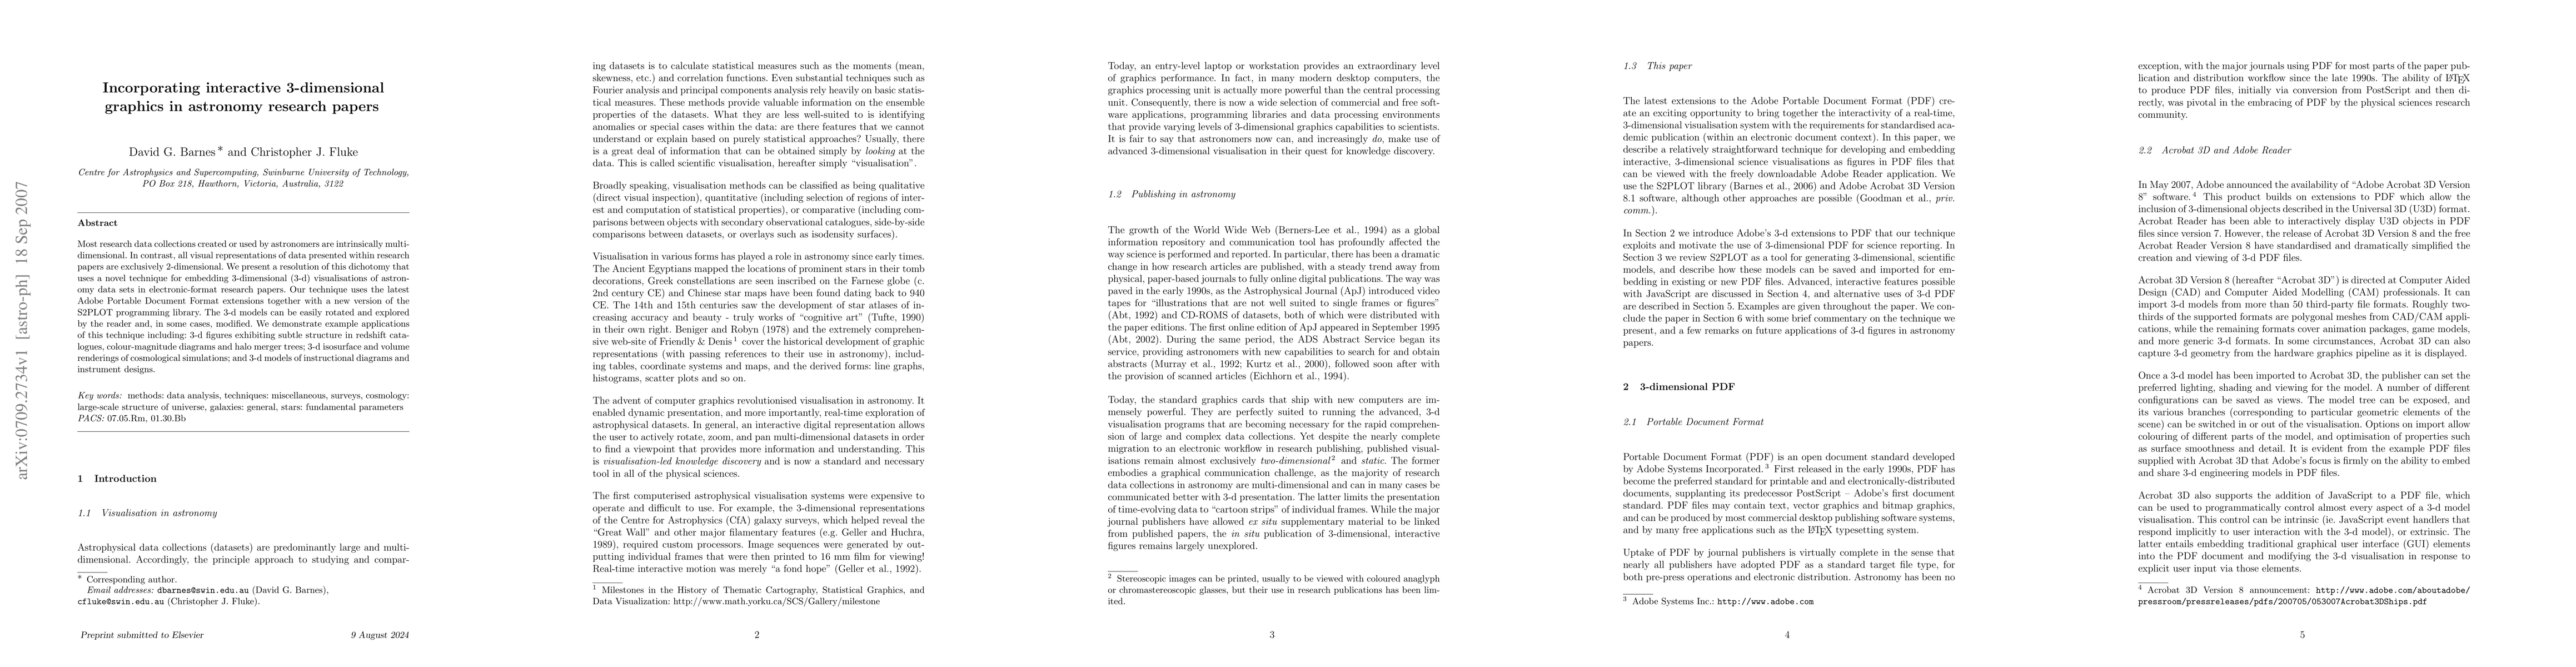
Most research data collections created or used by astronomers are intrinsically multi-dimensional. In contrast, all visual representations of data presented within research papers are exclusively 2-dimensional. We present a resolution of this dichotomy that uses a novel technique for embedding 3-dimensional (3-d) visualisations of astronomy data sets in electronic-format research papers. Our technique uses the latest Adobe Portable Document Format extensions together with a new version of the S2PLOT programming library. The 3-d models can be easily rotated and explored by the reader and, in some cases, modified. We demonstrate example applications of this technique including: 3-d figures exhibiting subtle structure in redshift catalogues, colour-magnitude diagrams and halo merger trees; 3-d isosurface and volume renderings of cosmological simulations; and 3-d models of instructional diagrams and instrument designs.
AI Key Findings
Get AI-generated insights about this paper's methodology, results, significance, and more — seven facets brought into focus.
Impact
Paper Details
PDF Preview
Key Terms
Citation Network
Current paper (gray), citations (green), references (blue)
Display is limited for performance on very large graphs.
Discussion 0