Publication
Metrics
Paper Preview
Abstract
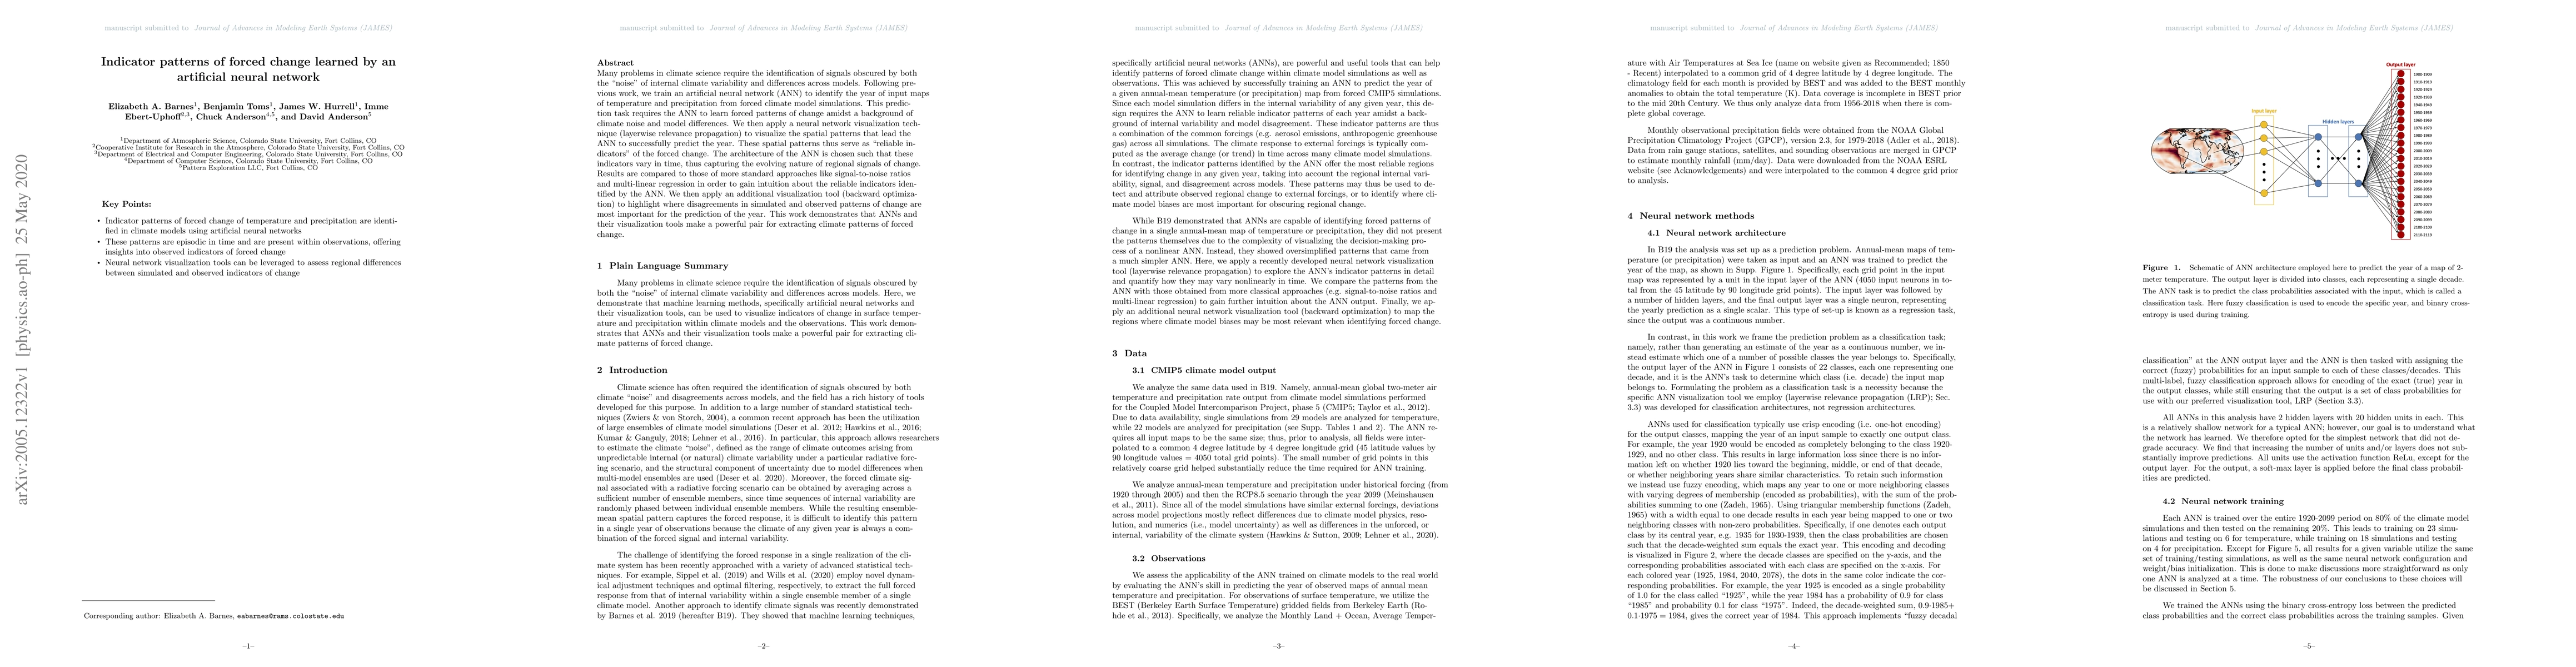
Many problems in climate science require the identification of signals obscured by both the "noise" of internal climate variability and differences across models. Following previous work, we train an artificial neural network (ANN) to identify the year of input maps of temperature and precipitation from forced climate model simulations. This prediction task requires the ANN to learn forced patterns of change amidst a background of climate noise and model differences. We then apply a neural network visualization technique (layerwise relevance propagation) to visualize the spatial patterns that lead the ANN to successfully predict the year. These spatial patterns thus serve as "reliable indicators" of the forced change. The architecture of the ANN is chosen such that these indicators vary in time, thus capturing the evolving nature of regional signals of change. Results are compared to those of more standard approaches like signal-to-noise ratios and multi-linear regression in order to gain intuition about the reliable indicators identified by the ANN. We then apply an additional visualization tool (backward optimization) to highlight where disagreements in simulated and observed patterns of change are most important for the prediction of the year. This work demonstrates that ANNs and their visualization tools make a powerful pair for extracting climate patterns of forced change.
AI Key Findings
Get AI-generated insights about this paper's methodology, results, significance, and more — seven facets brought into focus.
Impact
Paper Details
Authors
PDF Preview
Key Terms
Citation Network
Current paper (gray), citations (green), references (blue)
Display is limited for performance on very large graphs.
Discussion 0