Authors
Summary
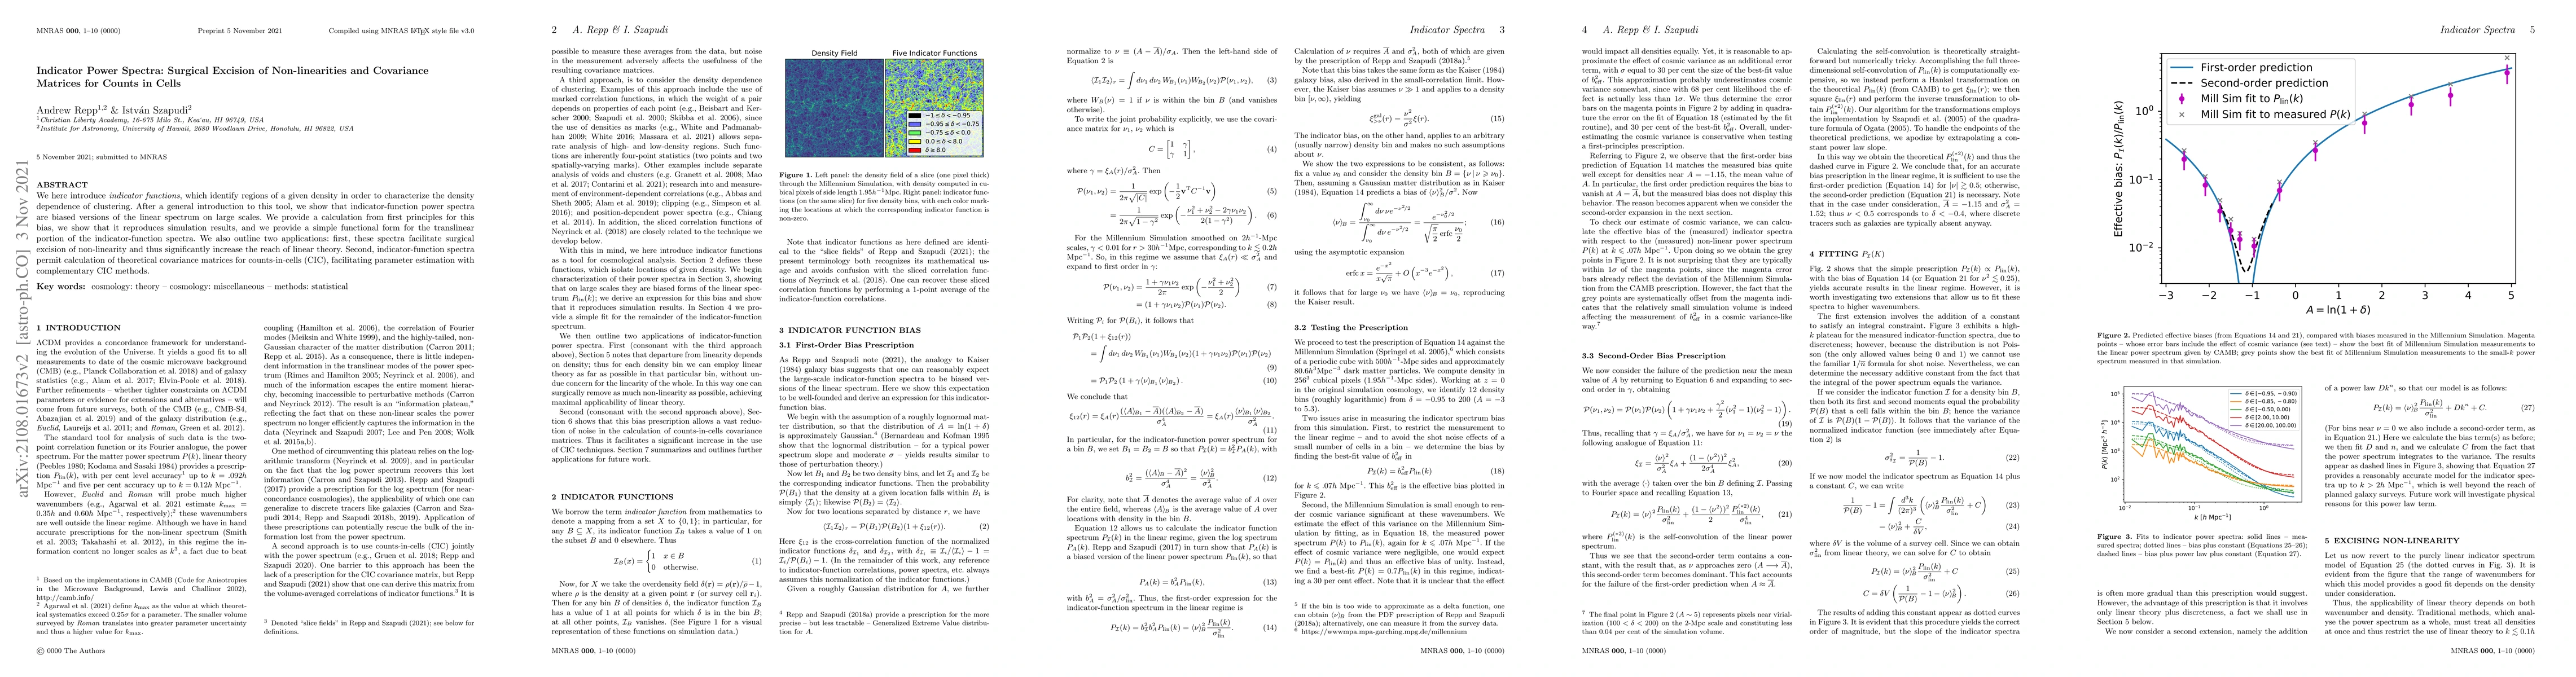
We here introduce indicator functions, which identify regions of a given density in order to characterize the density dependence of clustering. After a general introduction to this tool, we show that indicator-function power spectra are biased versions of the linear spectrum on large scales. We provide a calculation from first principles for this bias, we show that it reproduces simulation results, and we provide a simple functional form for the translinear portion of the indicator-function spectra. We also outline two applications: first, these spectra facilitate surgical excision of non-linearity and thus significantly increase the reach of linear theory. Second, indicator-function spectra permit calculation of theoretical covariance matrices for counts-in-cells (CIC), facilitating parameter estimation with complementary CIC methods.
AI Key Findings
Get AI-generated insights about this paper's methodology, results, and significance.
Paper Details
PDF Preview
Key Terms
Citation Network
Current paper (gray), citations (green), references (blue)
Display is limited for performance on very large graphs.
Similar Papers
Found 4 papers| Title | Authors | Year | Actions |
|---|
Comments (0)