Inference on Extreme Quantiles of Unobserved Individual Heterogeneity
Publication
Metrics
AI Quick Summary
This paper develops a new methodology for inferring extreme quantiles of unobserved individual heterogeneity in panel data or meta-analysis settings, using extreme value and intermediate order theorems to construct simple, non-optimized confidence intervals. The proposed method shows favorable coverage properties in simulations and is demonstrated through an application to firm productivity analysis.
Paper Preview
Abstract
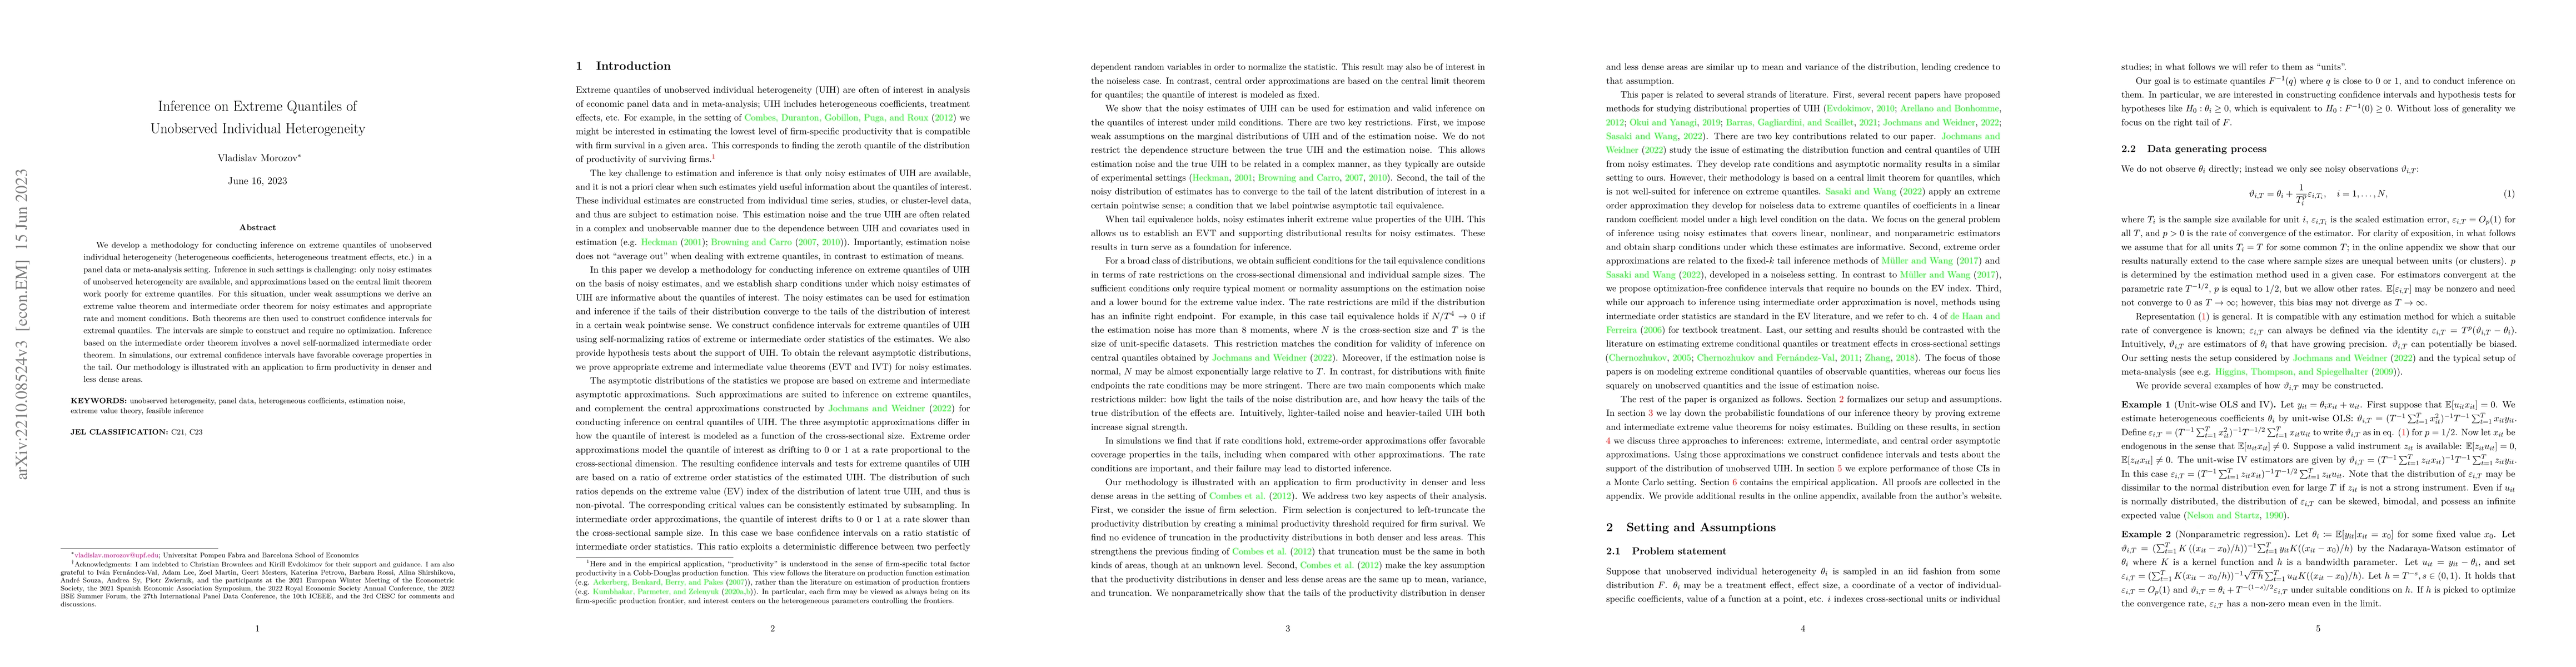
We develop a methodology for conducting inference on extreme quantiles of unobserved individual heterogeneity (heterogeneous coefficients, heterogeneous treatment effects, etc.) in a panel data or meta-analysis setting. Inference in such settings is challenging: only noisy estimates of unobserved heterogeneity are available, and approximations based on the central limit theorem work poorly for extreme quantiles. For this situation, under weak assumptions we derive an extreme value theorem and an intermediate order theorem for noisy estimates and appropriate rate and moment conditions. Both theorems are then used to construct confidence intervals for extremal quantiles. The intervals are simple to construct and require no optimization. Inference based on the intermediate order theorem involves a novel self-normalized intermediate order theorem. In simulations, our extremal confidence intervals have favorable coverage properties in the tail. Our methodology is illustrated with an application to firm productivity in denser and less dense areas.
AI Key Findings
Get AI-generated insights about this paper's methodology, results, significance, and more — seven facets brought into focus.
Impact
Paper Details
Authors
PDF Preview
Key Terms
Citation Network
Current paper (gray), citations (green), references (blue)
Display is limited for performance on very large graphs.
Discussion 0