Publication
Metrics
AI Quick Summary
This paper investigates the linear stability of wave-particle instabilities in the solar wind using Parker Solar Probe observations, modeling proton distributions with one- and two-component models. The study finds that both models predict resonant instabilities, with varying growth rates and unstable modes depending on the proton distribution model used.
Paper Preview
Abstract
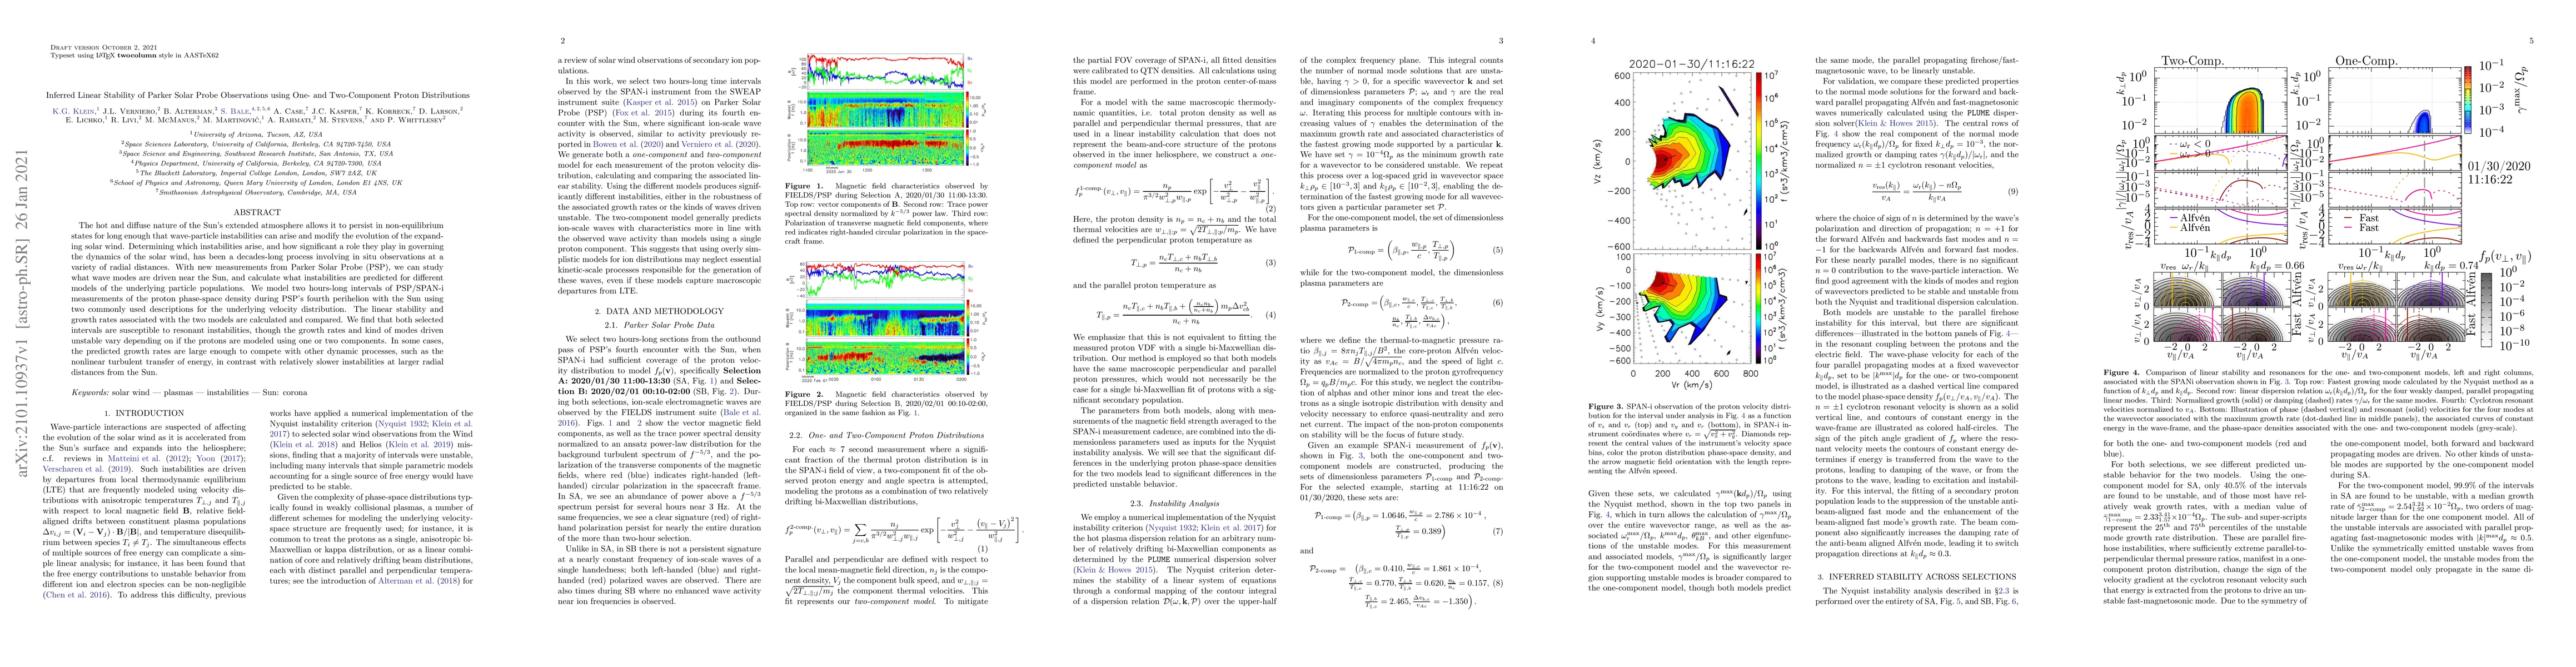
The hot and diffuse nature of the Sun's extended atmosphere allows it to persist in non-equilibrium states for long enough that wave-particle instabilities can arise and modify the evolution of the expanding solar wind. Determining which instabilities arise, and how significant a role they play in governing the dynamics of the solar wind, has been a decades-long process involving in situ observations at a variety of radial distances. With new measurements from Parker Solar Probe (PSP), we can study what wave modes are driven near the Sun, and calculate what instabilities are predicted for different models of the underlying particle populations. We model two hours-long intervals of PSP/SPAN-i measurements of the proton phase-space density during PSP's fourth perihelion with the Sun using two commonly used descriptions for the underlying velocity distribution. The linear stability and growth rates associated with the two models are calculated and compared. We find that both selected intervals are susceptible to resonant instabilities, though the growth rates and kind of modes driven unstable vary depending on if the protons are modeled using one or two components. In some cases, the predicted growth rates are large enough to compete with other dynamic processes, such as the nonlinear turbulent transfer of energy, in contrast with relatively slower instabilities at larger radial distances from the Sun.
AI Key Findings
Get AI-generated insights about this paper's methodology, results, significance, and more — seven facets brought into focus.
Impact
Paper Details
Authors
PDF Preview
Key Terms
Citation Network
Current paper (gray), citations (green), references (blue)
Display is limited for performance on very large graphs.
Discussion 0