Publication
Metrics
AI Quick Summary
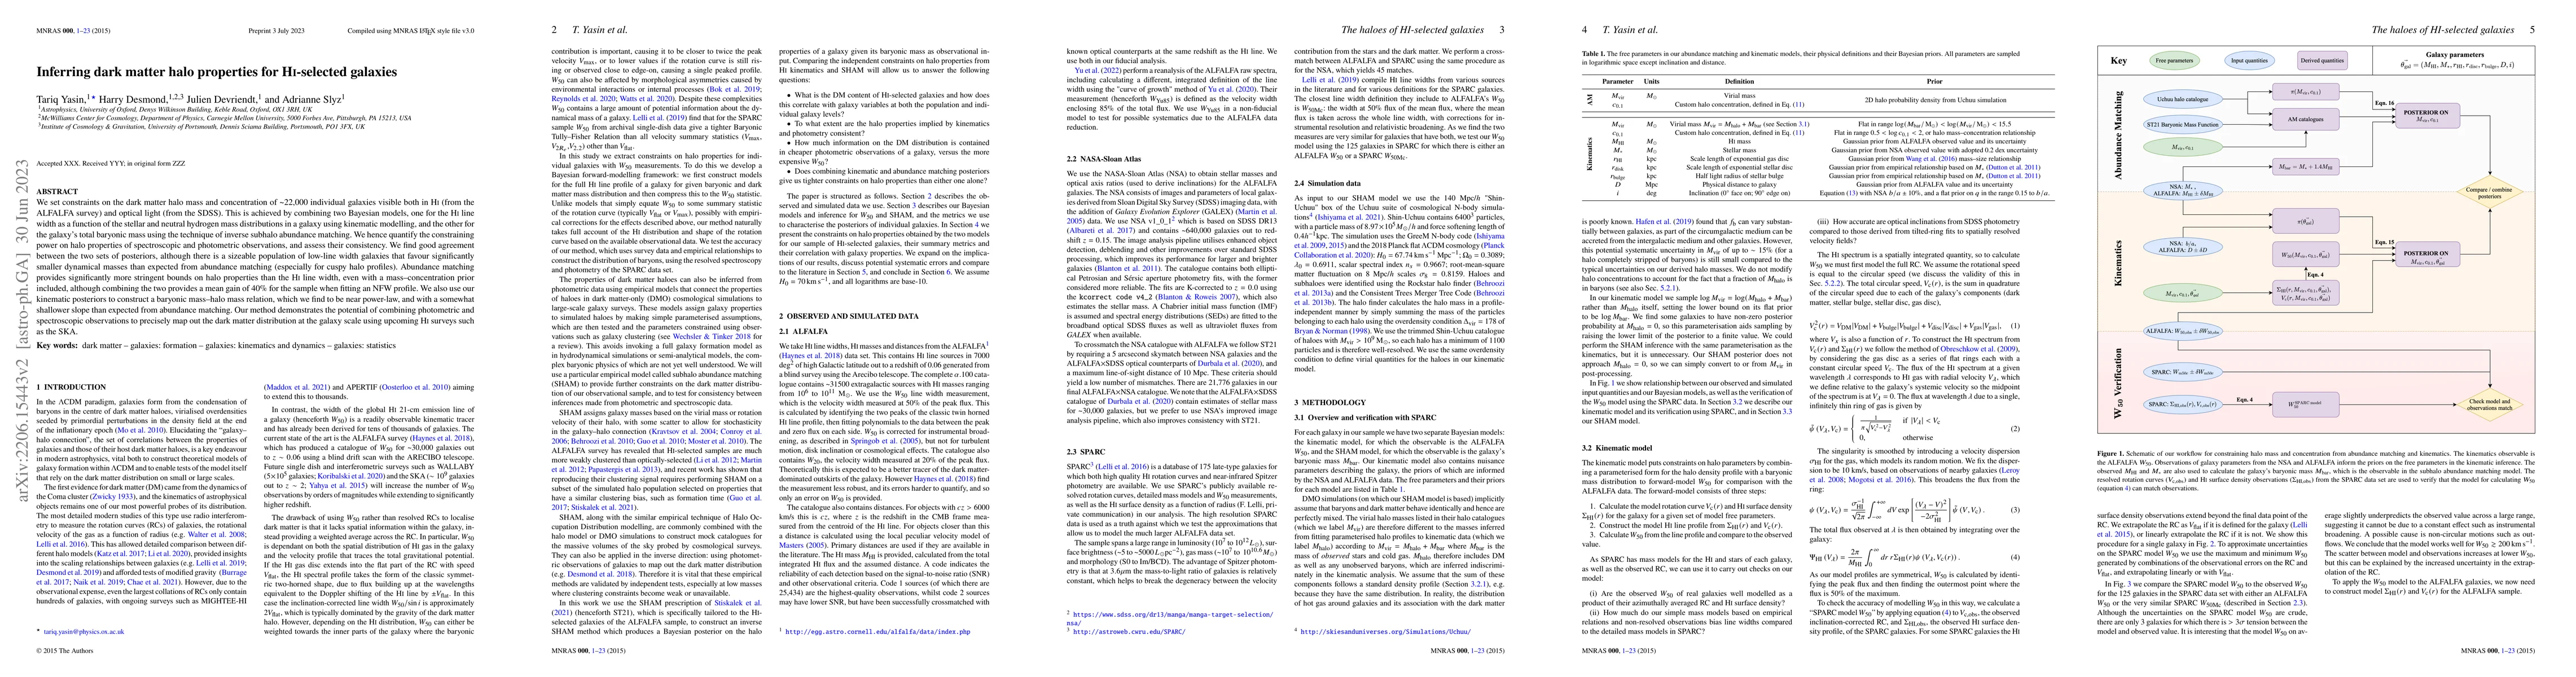
This paper combines Bayesian models to infer dark matter halo properties for ~22,000 HI-selected galaxies, finding good agreement between HI line width and inverse subhalo abundance matching. The study shows a 40% mean gain in constraining halo properties when combining both methods, highlighting the potential of integrating spectroscopic and photometric data for future dark matter mapping.
Paper Preview
Abstract
We set constraints on the dark matter halo mass and concentration of ~22,000 individual galaxies visible both in HI (from the ALFALFA survey) and optical light (from the SDSS). This is achieved by combining two Bayesian models, one for the HI line width as a function of the stellar and neutral hydrogen mass distributions in a galaxy using kinematic modelling, and the other for the galaxy's total baryonic mass using the technique of inverse subhalo abundance matching. We hence quantify the constraining power on halo properties of spectroscopic and photometric observations, and assess their consistency. We find good agreement between the two sets of posteriors, although there is a sizeable population of low-line width galaxies that favour significantly smaller dynamical masses than expected from abundance matching (especially for cuspy halo profiles). Abundance matching provides significantly more stringent bounds on halo properties than the HI line width, even with a mass--concentration prior included, although combining the two provides a mean gain of 40% for the sample when fitting an NFW profile. We also use our kinematic posteriors to construct a baryonic mass--halo mass relation, which we find to be near power-law, and with a somewhat shallower slope than expected from abundance matching. Our method demonstrates the potential of combining photometric and spectroscopic observations to precisely map out the dark matter distribution at the galaxy scale using upcoming HI surveys such as the SKA.
AI Key Findings
Get AI-generated insights about this paper's methodology, results, significance, and more — seven facets brought into focus.
Impact
Paper Details
Authors
PDF Preview
Key Terms
Citation Network
Current paper (gray), citations (green), references (blue)
Display is limited for performance on very large graphs.
Discussion 0