Summary
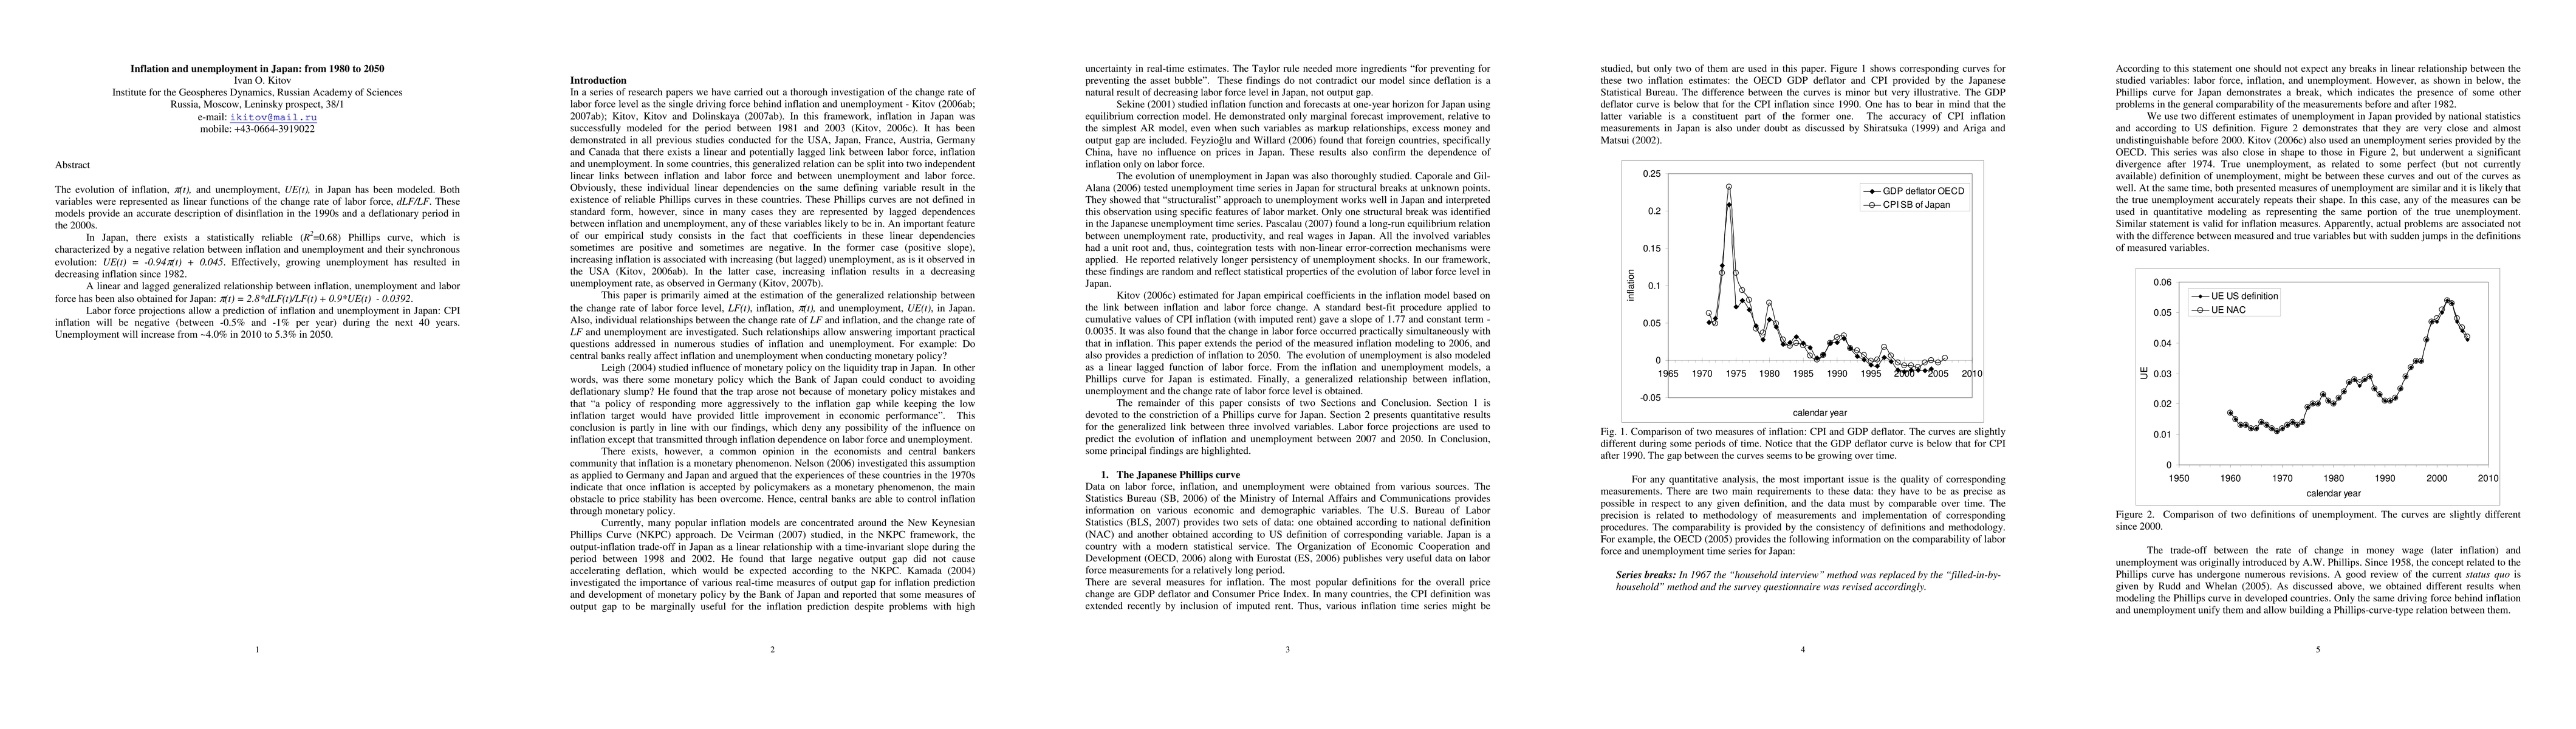
The evolution of inflation, p(t), and unemployment, UE(t), in Japan has been modeled. Both variables were represented as linear functions of the change rate of labor force, dLF/LF. These models provide an accurate description of disinflation in the 1990s and a deflationary period in the 2000s. In Japan, there exists a statistically reliable (R2=0.68) Phillips curve, which is characterized by a negative relation between inflation and unemployment and their synchronous evolution: UE(t) = -0.94p(t) + 0.045. Effectively, growing unemployment has resulted in decreasing inflation since 1982. A linear and lagged generalized relationship between inflation, unemployment and labor force has been also obtained for Japan: p(t) = 2.8*dLF(t)/LF(t) + 0.9*UE(t) - 0.0392. Labor force projections allow a prediction of inflation and unemployment in Japan: CPI inflation will be negative (between -0.5% and -1% per year) during the next 40 years. Unemployment will increase from ~4.0% in 2010 to 5.3% in 2050.
AI Key Findings
Get AI-generated insights about this paper's methodology, results, and significance.
Paper Details
PDF Preview
Key Terms
Citation Network
Current paper (gray), citations (green), references (blue)
Display is limited for performance on very large graphs.
| Title | Authors | Year | Actions |
|---|
Comments (0)