Publication
Metrics
AI Quick Summary
The Influence Flower is a new visual metaphor that reveals the flow of influence between academic entities, allowing researchers to analyze career patterns, paper recognition, institutional profiles, and topical trends over time.
Paper Preview
Abstract
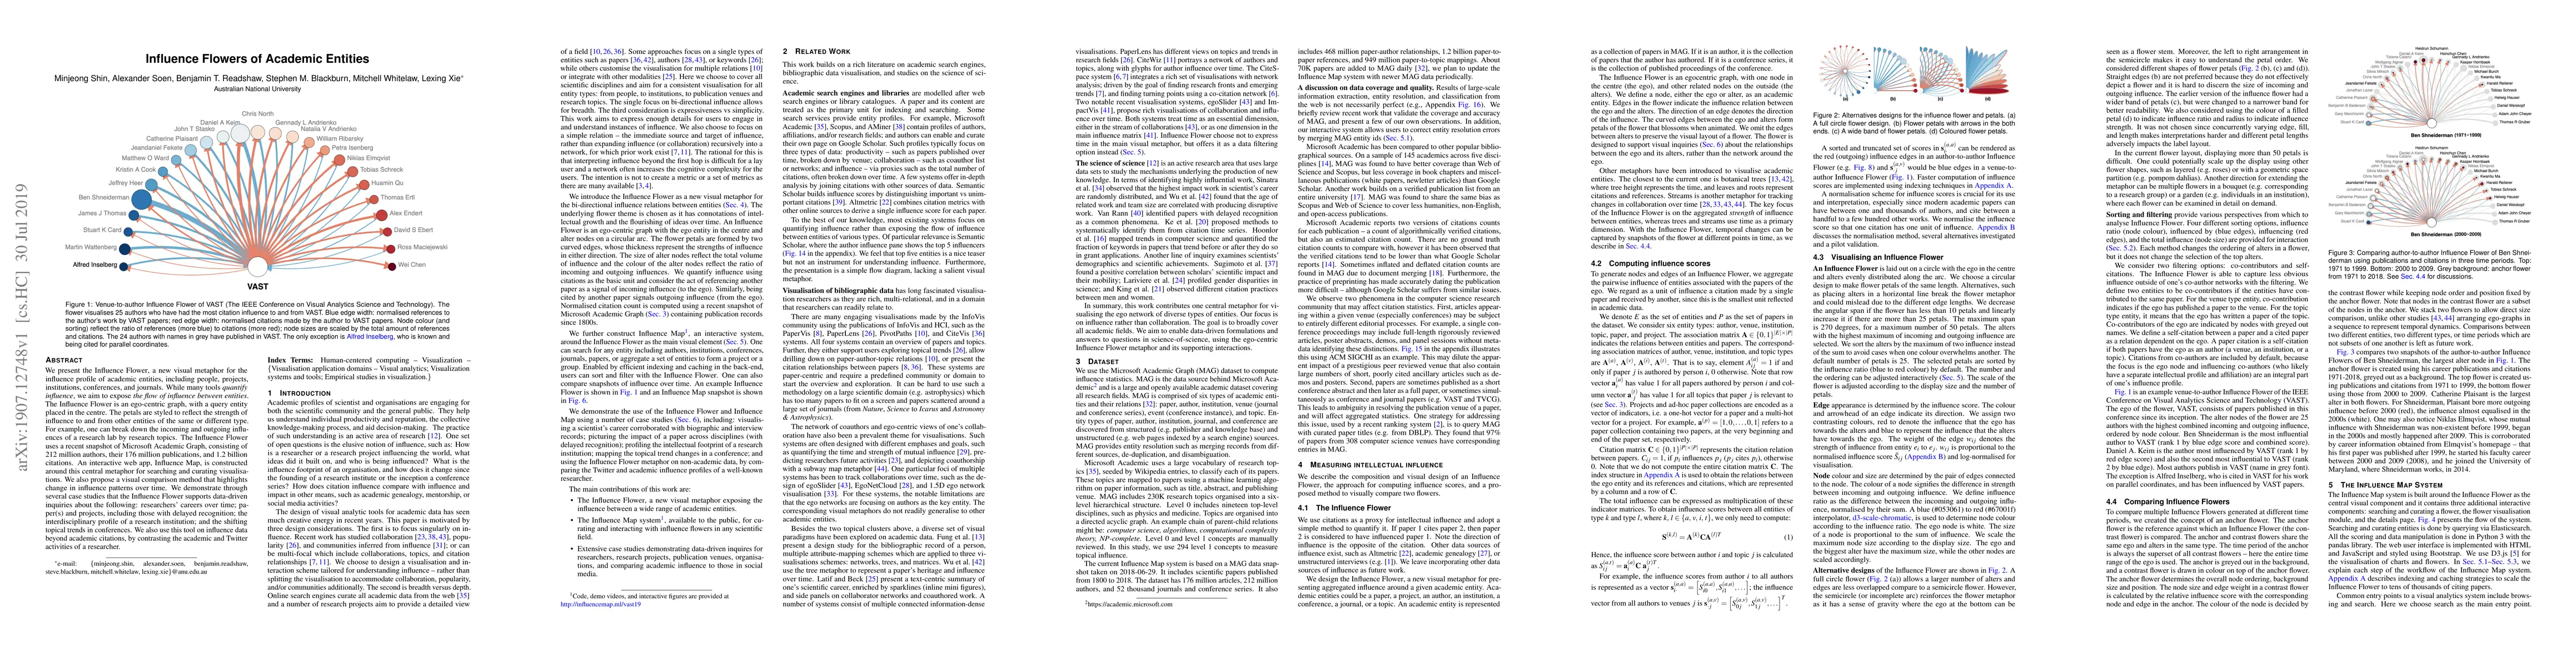
We present the Influence Flower, a new visual metaphor for the influence profile of academic entities, including people, projects, institutions, conferences, and journals. While many tools quantify influence, we aim to expose the flow of influence between entities. The Influence Flower is an ego-centric graph, with a query entity placed in the centre. The petals are styled to reflect the strength of influence to and from other entities of the same or different type. For example, one can break down the incoming and outgoing influences of a research lab by research topics. The Influence Flower uses a recent snapshot of Microsoft Academic Graph, consisting of 212million authors, their 176 million publications, and 1.2 billion citations. An interactive web app, Influence Map, is constructed around this central metaphor for searching and curating visualisations. We also propose a visual comparison method that highlights change in influence patterns over time. We demonstrate through several case studies that the Influence Flower supports data-driven inquiries about the following: researchers' careers over time; paper(s) and projects, including those with delayed recognition; the interdisciplinary profile of a research institution; and the shifting topical trends in conferences. We also use this tool on influence data beyond academic citations, by contrasting the academic and Twitter activities of a researcher.
AI Key Findings
Get AI-generated insights about this paper's methodology, results, significance, and more — seven facets brought into focus.
Impact
Paper Details
PDF Preview
Key Terms
Citation Network
Current paper (gray), citations (green), references (blue)
Display is limited for performance on very large graphs.
Discussion 0