Summary
Biogeographical regions (bioregions) reveal how different sets of species are spatially grouped and therefore are important units for conservation, historical biogeography, ecology and evolution. Several methods have been developed to identify bioregions based on species distribution data rather than expert opinion. One approach successfully applies network theory to simplify and highlight the underlying structure in species distributions. However, this method lacks tools for simple and efficient analysis. Here we present Infomap Bioregions, an interactive web application that inputs species distribution data and generates bioregion maps. Species distributions may be provided as georeferenced point occurrences or range maps, and can be of local, regional or global scale. The application uses a novel adaptive resolution method to make best use of often incomplete species distribution data. The results can be downloaded as vector graphics, shapefiles or in table format. We validate the tool by processing large datasets of publicly available species distribution data of the world's amphibians using species ranges, and mammals using point occurrences. We then calculate the fit between the inferred bioregions and WWF ecoregions. As examples of applications, researchers can reconstruct ancestral ranges in historical biogeography or identify indicator species for targeted conservation.
AI Key Findings
Generated Sep 03, 2025
Methodology
Infomap Bioregions is an interactive web application that generates bioregion maps from species distribution data, using an adaptive resolution method to handle incomplete data. It forms a bipartite network with species and grid cells, clustering them using Infomap for bipartite networks.
Key Results
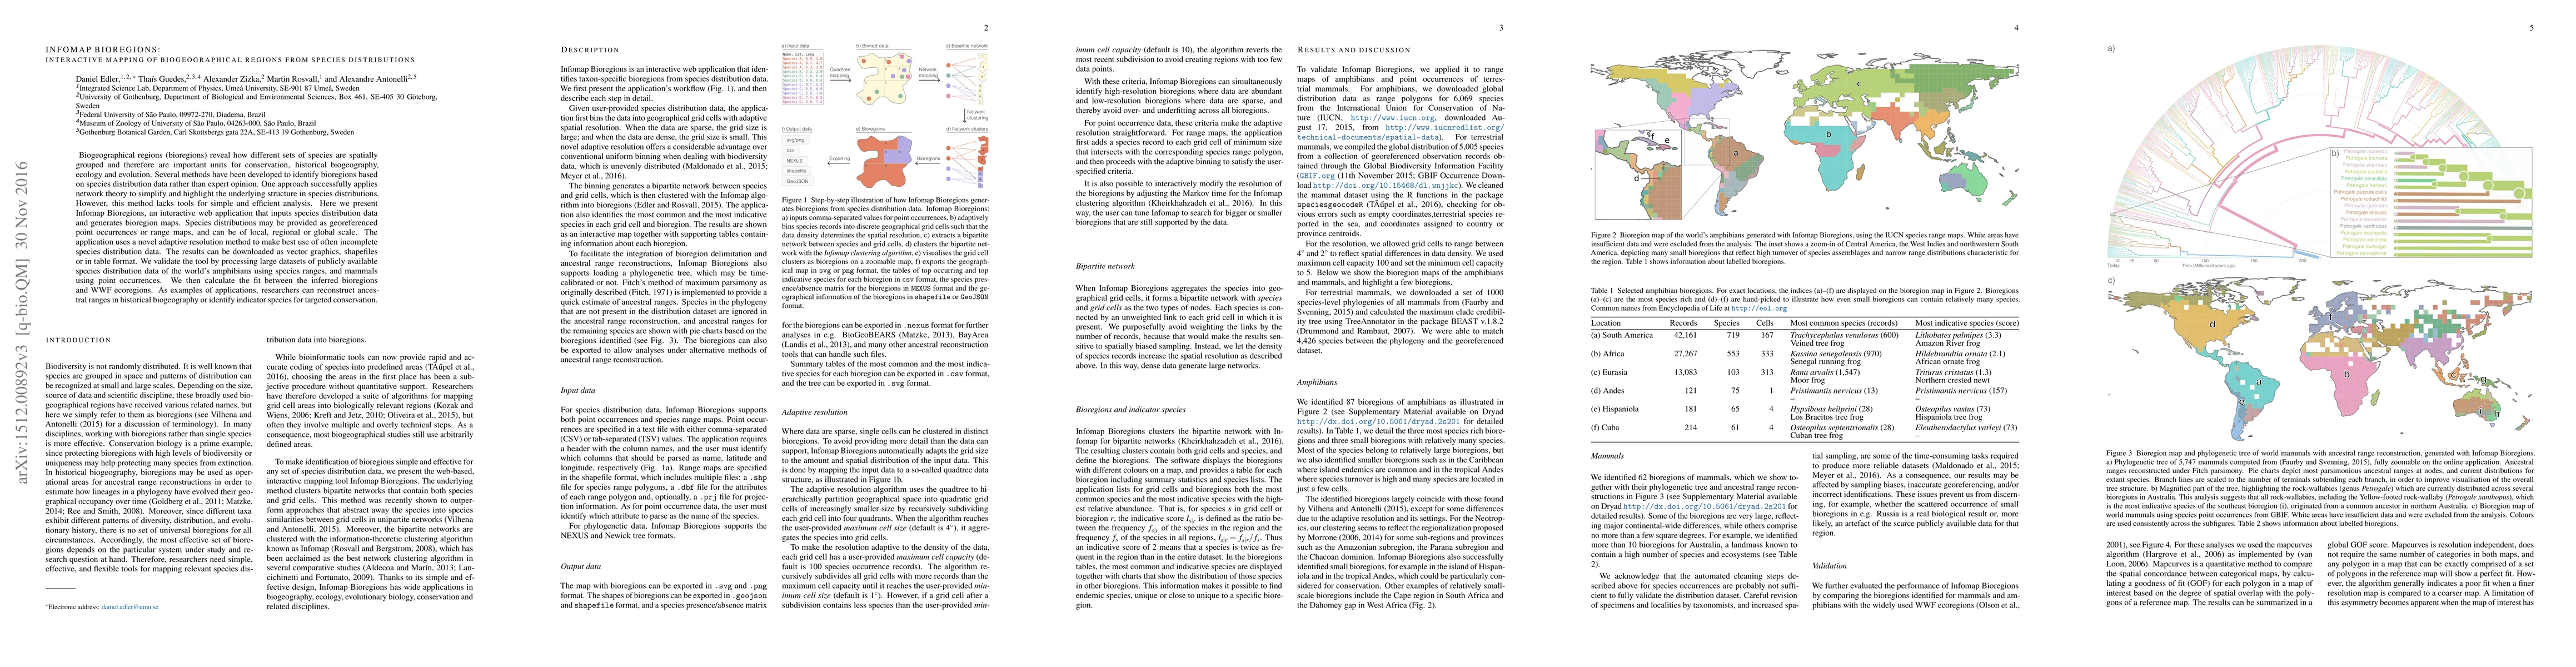
- Identified 87 amphibian bioregions and 62 mammal bioregions globally.
- Bioregions largely coincide with those found by Vilhena and Antonelli (2015) but also reveal smaller-scale bioregions.
- The tool successfully identified small bioregions, such as in the Andes, Hispaniola, Caperegion in South Africa, and the Dahomey gap in West Africa.
Significance
This research provides an important tool for conservation, historical biogeography, ecology, and evolution by enabling the identification of bioregions from species distribution data, which can help in reconstructing ancestral ranges and identifying indicator species.
Technical Contribution
Infomap Bioregions introduces an adaptive resolution method for generating bioregion maps from species distribution data, allowing for simultaneous identification of high-resolution bioregions with abundant data and low-resolution bioregions with sparse data.
Novelty
Unlike previous methods, Infomap Bioregions offers an interactive web application with an adaptive resolution method, making it more user-friendly and efficient for generating bioregion maps from species distribution data.
Limitations
- The automated cleaning steps for species occurrence data may not be sufficient to fully validate the distribution dataset.
- Results may be affected by sampling biases, inaccurate georeferencing, and/or incorrect identifications.
Future Work
- Further validation of the tool using expert-curated datasets.
- Development of methods to better handle and mitigate sampling biases and inaccuracies in species occurrence data.
Paper Details
PDF Preview
Key Terms
Citation Network
Current paper (gray), citations (green), references (blue)
Display is limited for performance on very large graphs.
Similar Papers
Found 4 papersInfomap Bioregions 2 - Exploring the interplay between biogeography and evolution
Daniel Edler, Martin Rosvall, Anton Holmgren et al.
Biogeographical network analysis of plant species distribution in the Mediterranean region
Maxime Lenormand, Guillaume Papuga, Samuel Alleaume et al.
| Title | Authors | Year | Actions |
|---|
Comments (0)