Publication
Metrics
AI Quick Summary
This research proposes a systematic method using near-infrared spectral indices to pre-select mid- and late-T dwarf brown dwarfs likely to exhibit higher variability. The indices were tested on existing spectra, identifying eight new variable candidates and confirming the high variability fraction in T dwarfs, suggesting these indices could help identify variable exoplanets.
Paper Preview
Abstract
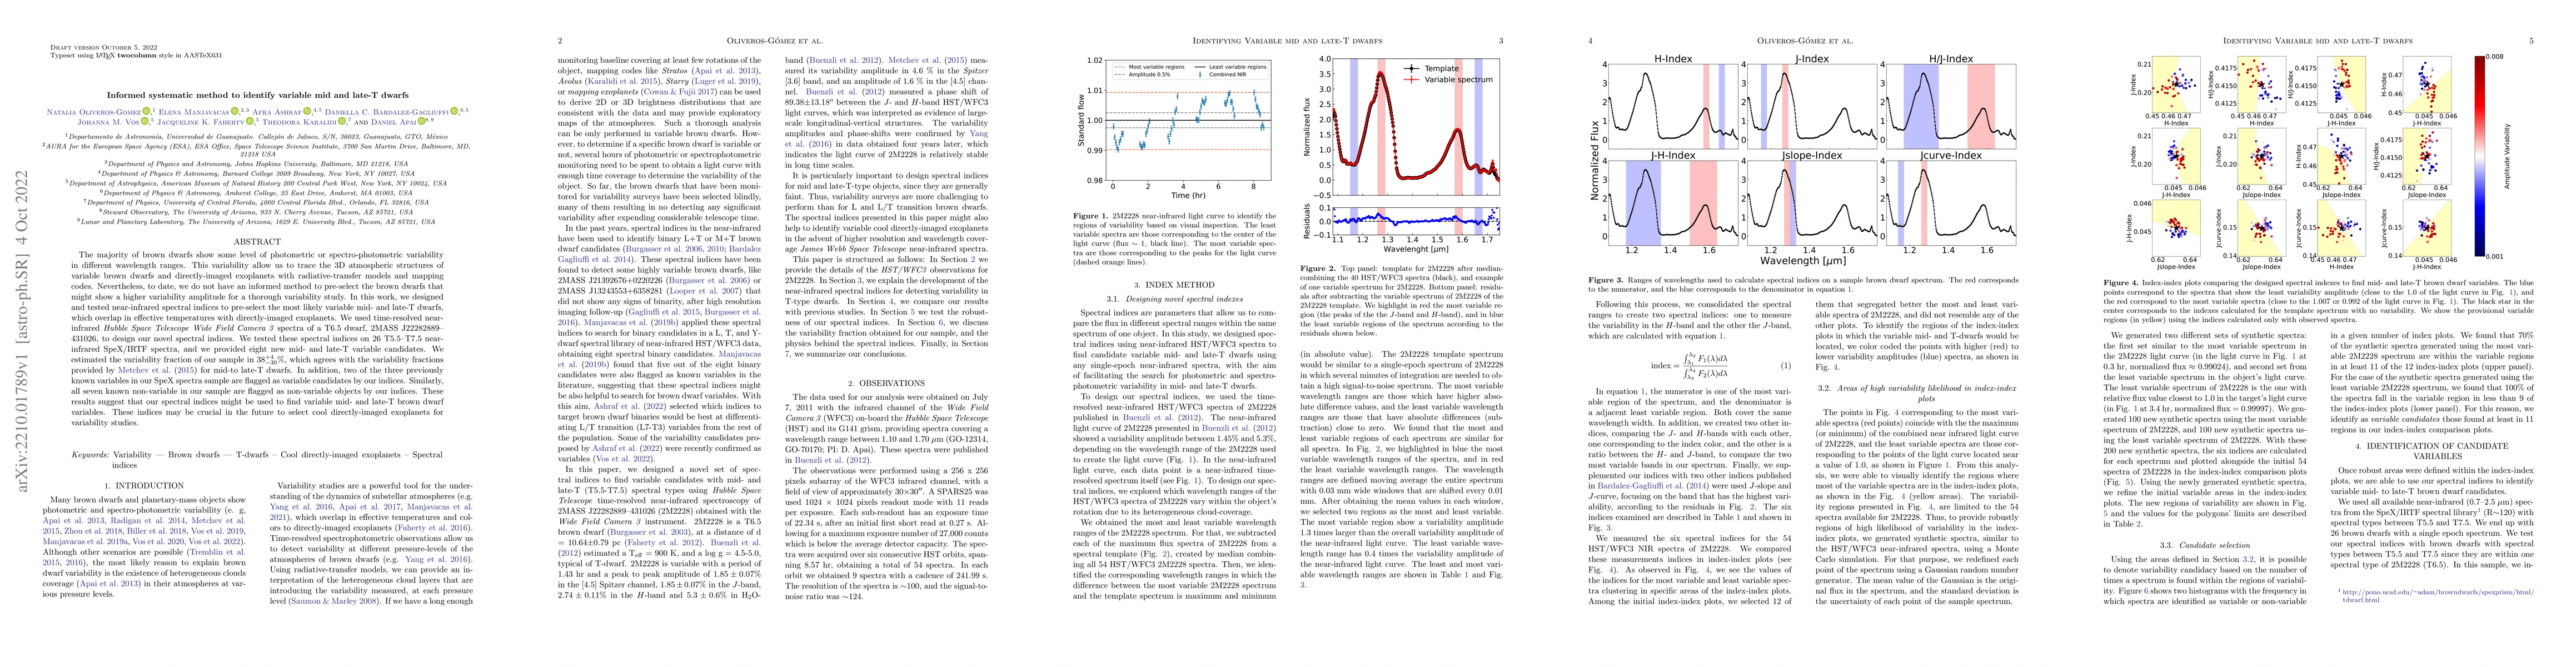
The majority of brown dwarfs show some level of photometric or spectro-photometric variability in different wavelength ranges. This variability allow us to trace the 3D atmospheric structures of variable brown dwarfs and directly-imaged exoplanets with radiative-transfer models and mapping codes. Nevertheless, to date, we do not have an informed method to pre-select the brown dwarfs that might show a higher variability amplitude for a thorough variability study. In this work, we designed and tested near-infrared spectral indices to pre-select the most likely variable mid- and late-T dwarfs, which overlap in effective temperatures with directly-imaged exoplanets. We used time-resolved near-infrared Hubble Space Telescope Wide Field Camera 3 spectra of a T6.5 dwarf, 2MASS J22282889--431026, to design our novel spectral indices. We tested these spectral indices on 26 T5.5--T7.5 near-infrared SpeX/IRTF spectra, and we provided eight new mid- and late-T variable candidates. We estimated the variability fraction of our sample in $38^{+4}_{-30}$%, which agrees with the variability fractions provided by Metchev, et. al, (2015) for mid-to late-T dwarfs. In addition, two of the three previously known variables in our SpeX spectra sample are flagged as variable candidates by our indices. Similarly, all seven known non-variable in our sample are flagged as non-variable objects by our indices. These results suggest that our spectral indices might be used to find variable mid- and late-T brown dwarf variables. These indices may be crucial in the future to select cool directly-imaged exoplanets for variability studies.
AI Key Findings
Get AI-generated insights about this paper's methodology, results, significance, and more — seven facets brought into focus.
Impact
Paper Details
Authors
PDF Preview
Key Terms
Citation Network
Current paper (gray), citations (green), references (blue)
Display is limited for performance on very large graphs.
Discussion 0