Summary
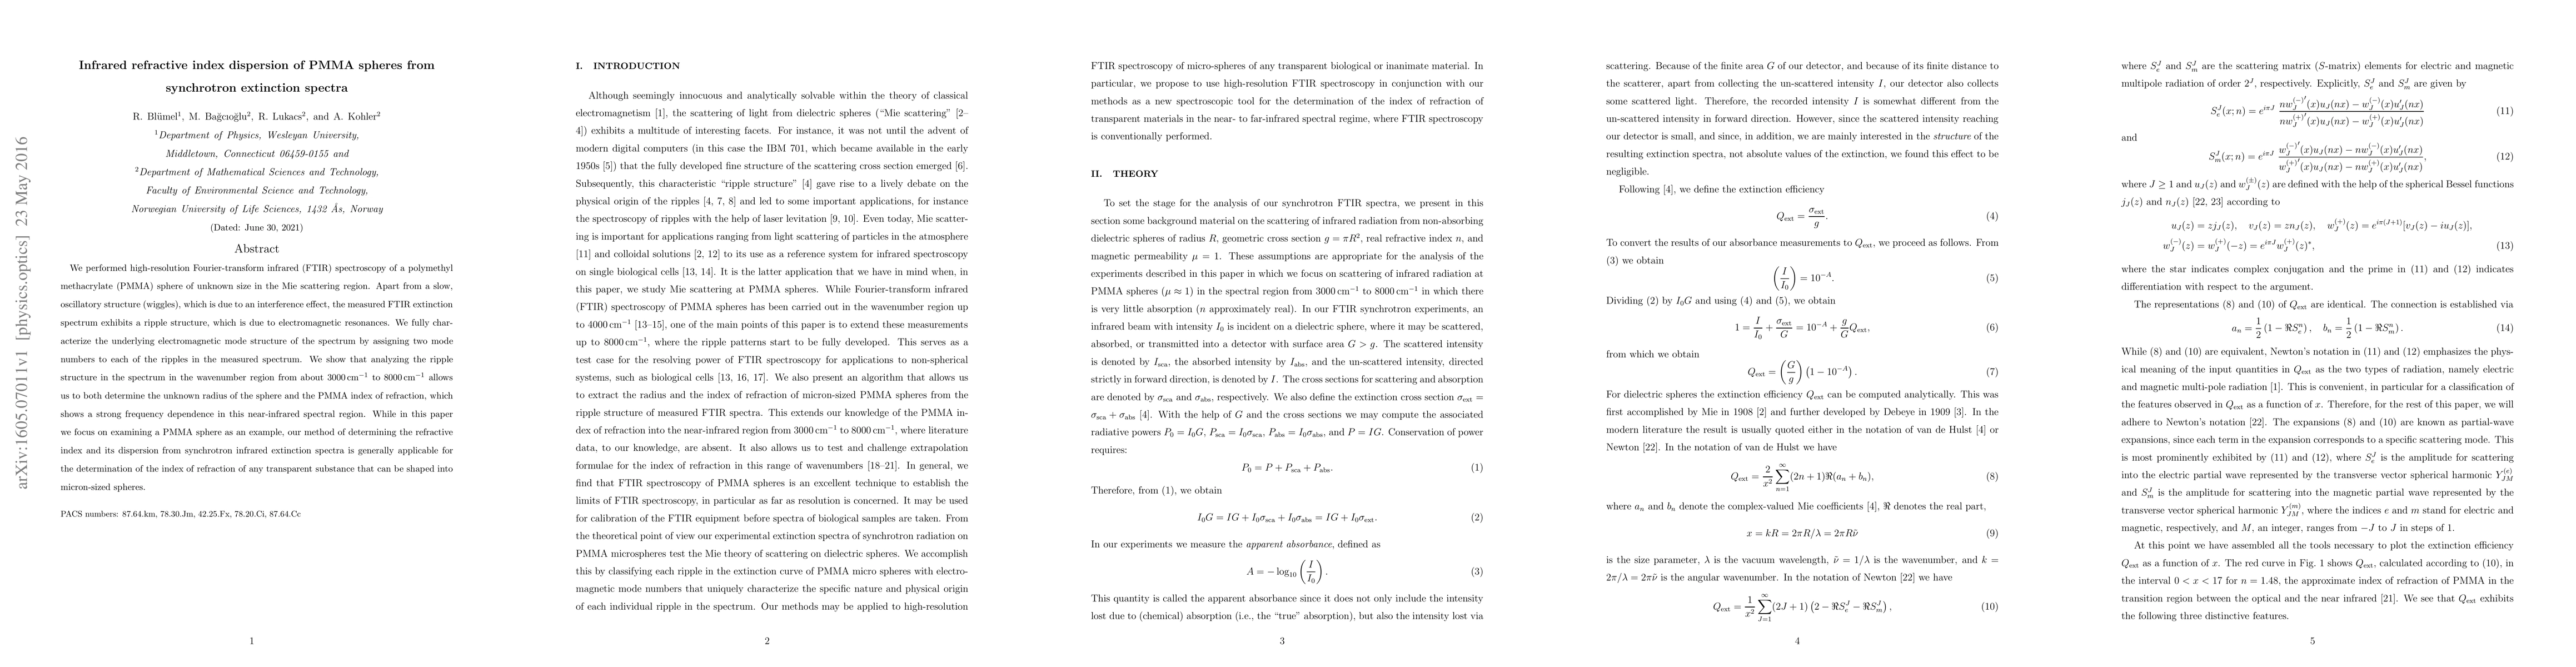
We performed high-resolution Fourier-transform infrared (FTIR) spectroscopy of a polymethyl methacrylate (PMMA) sphere of unknown size in the Mie scattering region. Apart from a slow, oscillatory structure (wiggles), which is due to an interference effect, the measured FTIR extinction spectrum exhibits a ripple structure, which is due to electromagnetic resonances. We fully characterize the underlying electromagnetic mode structure of the spectrum by assigning two mode numbers to each of the ripples in the measured spectrum. We show that analyzing the ripple structure in the spectrum in the wavenumber region from about $3000\,$cm$^{-1}$ to $8000\,$cm$^{-1}$ allows us to both determine the unknown radius of the sphere and the PMMA index of refraction, which shows a strong frequency dependence in this near-infrared spectral region. While in this paper we focus on examining a PMMA sphere as an example, our method of determining the refractive index and its dispersion from synchrotron infrared extinction spectra is generally applicable for the determination of the index of refraction of any transparent substance that can be shaped into micron-sized spheres.
AI Key Findings
Get AI-generated insights about this paper's methodology, results, and significance.
Paper Details
PDF Preview
Key Terms
Citation Network
Current paper (gray), citations (green), references (blue)
Display is limited for performance on very large graphs.
Similar Papers
Found 4 papersSpace-resolved Chemical Information from Infrared Extinction Spectra
Reinhold Blümel, Kalpa de Silva, Proity Akbar
Nanoscale local modification of PMMA refractive index by tip-enhanced femtosecond pulsed laser irradiation
Adrian M. Ionescu, Denis E. Tranca, Stefan G. Stanciu et al.
Complex refractive index measurements of Poly(methyl methacrylate) (PMMA) over the UV-VIS-NIR region
Hung Q. Nguyen, Pham Thi Hong, H. T. M. Nghiem
| Title | Authors | Year | Actions |
|---|
Comments (0)