Summary
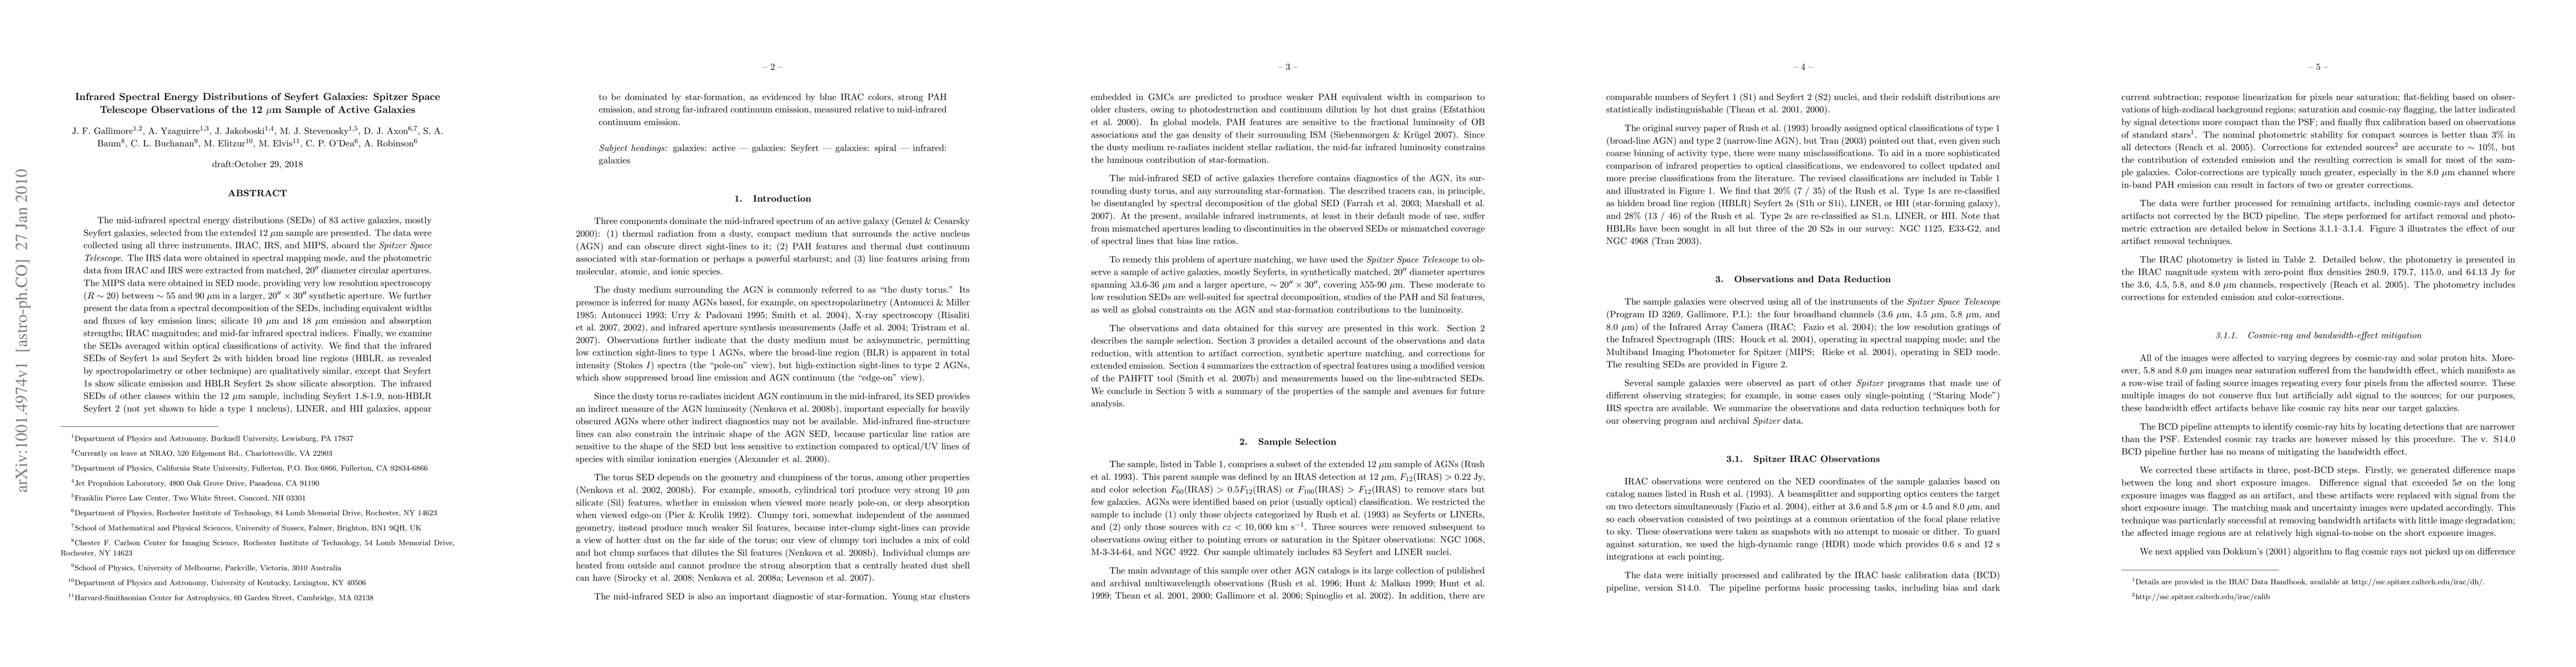
The mid-far-infrared spectral energy distributions (SEDs) of 83 active galaxies, mostly Seyfert galaxies, selected from the extended 12 micron sample are presented. The data were collected using all three instruments, IRAC, IRS, and MIPS, aboard the Spitzer Space Telescope. The IRS data were obtained in spectral mapping mode, and the photometric data from IRAC and IRS were extracted from matched, 20 arcsec diameter circular apertures. The MIPS data were obtained in SED mode, providing very low resolution spectroscopy (R ~ 20) between ~ 55 and 90 microns in a larger, 20 by 30 arcsec synthetic aperture. We further present the data from a spectral decomposition of the SEDs, including equivalent widths and fluxes of key emission lines; silicate 10 and 18 micron emission and absorption strengths; IRAC magnitudes; and mid-far infrared spectral indices. Finally, we examine the SEDs averaged within optical classifications of activity. We find that the infrared SEDs of Seyfert 1s and Seyfert 2s with hidden broad line regions (HBLR, as revealed by spectropolarimetry or other technique) are qualitatively similar, except that Seyfert 1s show silicate emission and HBLR Seyfert 2s show silicate absorption. The infrared SEDs of other classes with the 12 micron sample, including Seyfert 1.8-1.9, non-HBLR Seyfert 2 (not yet shown to hide a type 1 nucleus), LINER and HII galaxies, appear to be dominated by star-formation, as evidenced by blue IRAC colors, strong PAH emission, and strong far-infrared continuum emission, measured relative to mid-infrared continuum emission.
AI Key Findings
Get AI-generated insights about this paper's methodology, results, and significance.
Paper Details
PDF Preview
Key Terms
Citation Network
Current paper (gray), citations (green), references (blue)
Display is limited for performance on very large graphs.
Similar Papers
Found 4 papers| Title | Authors | Year | Actions |
|---|
Comments (0)