Publication
Metrics
AI Quick Summary
This study uses high-precision infrared surface brightness fluctuation (SBF) measurements from the Hubble Space Telescope to determine distances for 63 massive early-type galaxies, achieving a median uncertainty of 3.9%. The results improve mass estimates for galaxies and provide valuable data for calibrating Type Ia supernova distances.
Paper Preview
Abstract
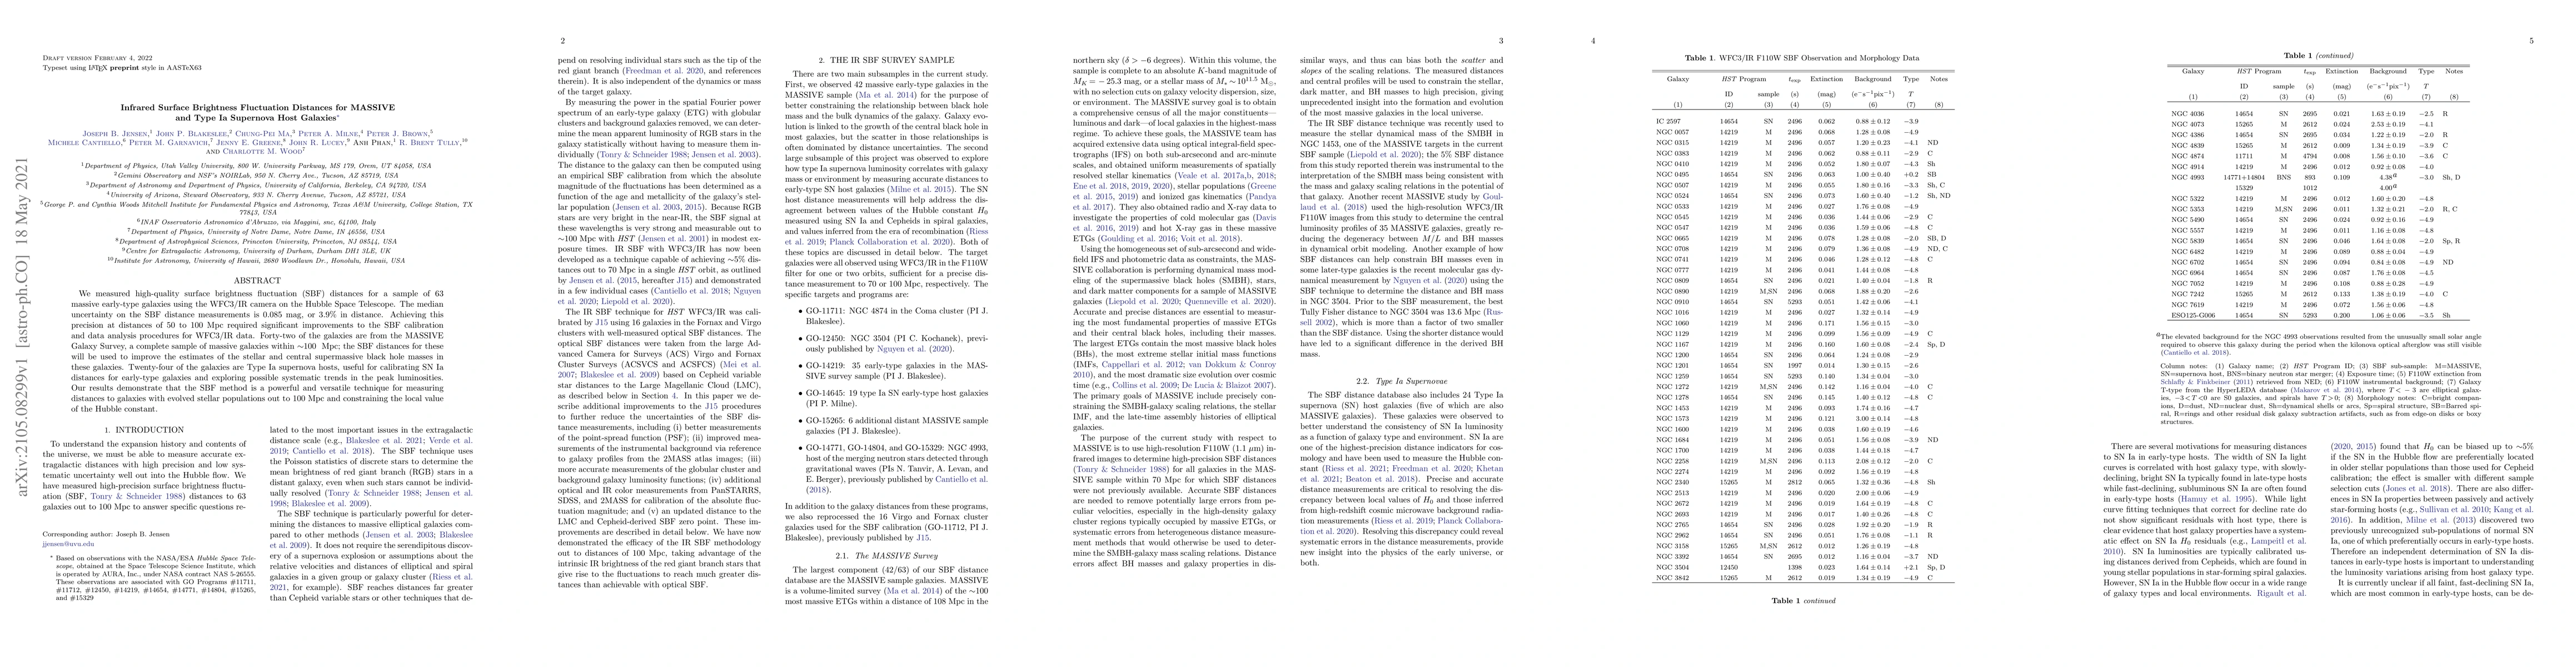
We measured high-quality surface brightness fluctuation (SBF) distances for a sample of 63 massive early-type galaxies using the WFC3/IR camera on the Hubble Space Telescope. The median uncertainty on the SBF distance measurements is 0.085 mag, or 3.9% in distance. Achieving this precision at distances of 50 to 100 Mpc required significant improvements to the SBF calibration and data analysis procedures for WFC3/IR data. Forty-two of the galaxies are from the MASSIVE Galaxy Survey, a complete sample of massive galaxies within ~100 Mpc; the SBF distances for these will be used to improve the estimates of the stellar and central supermassive black hole masses in these galaxies. Twenty-four of the galaxies are Type Ia supernova hosts, useful for calibrating SN Ia distances for early-type galaxies and exploring possible systematic trends in the peak luminosities. Our results demonstrate that the SBF method is a powerful and versatile technique for measuring distances to galaxies with evolved stellar populations out to 100 Mpc and constraining the local value of the Hubble constant.
AI Key Findings
Get AI-generated insights about this paper's methodology, results, significance, and more — seven facets brought into focus.
Discussion 0