inlamemi: An R package for missing data imputation and measurement error modelling using INLA
Publication
Metrics
AI Quick Summary
The "inlamemi" R package facilitates the imputation of missing data and modelling of measurement error in statistical models through Bayesian methods using INLA, offering a user-friendly tool for data analysts to address these common issues in a straightforward manner. It provides practical examples to guide users in formulating appropriate hierarchical models for various scenarios.
Paper Preview
Abstract
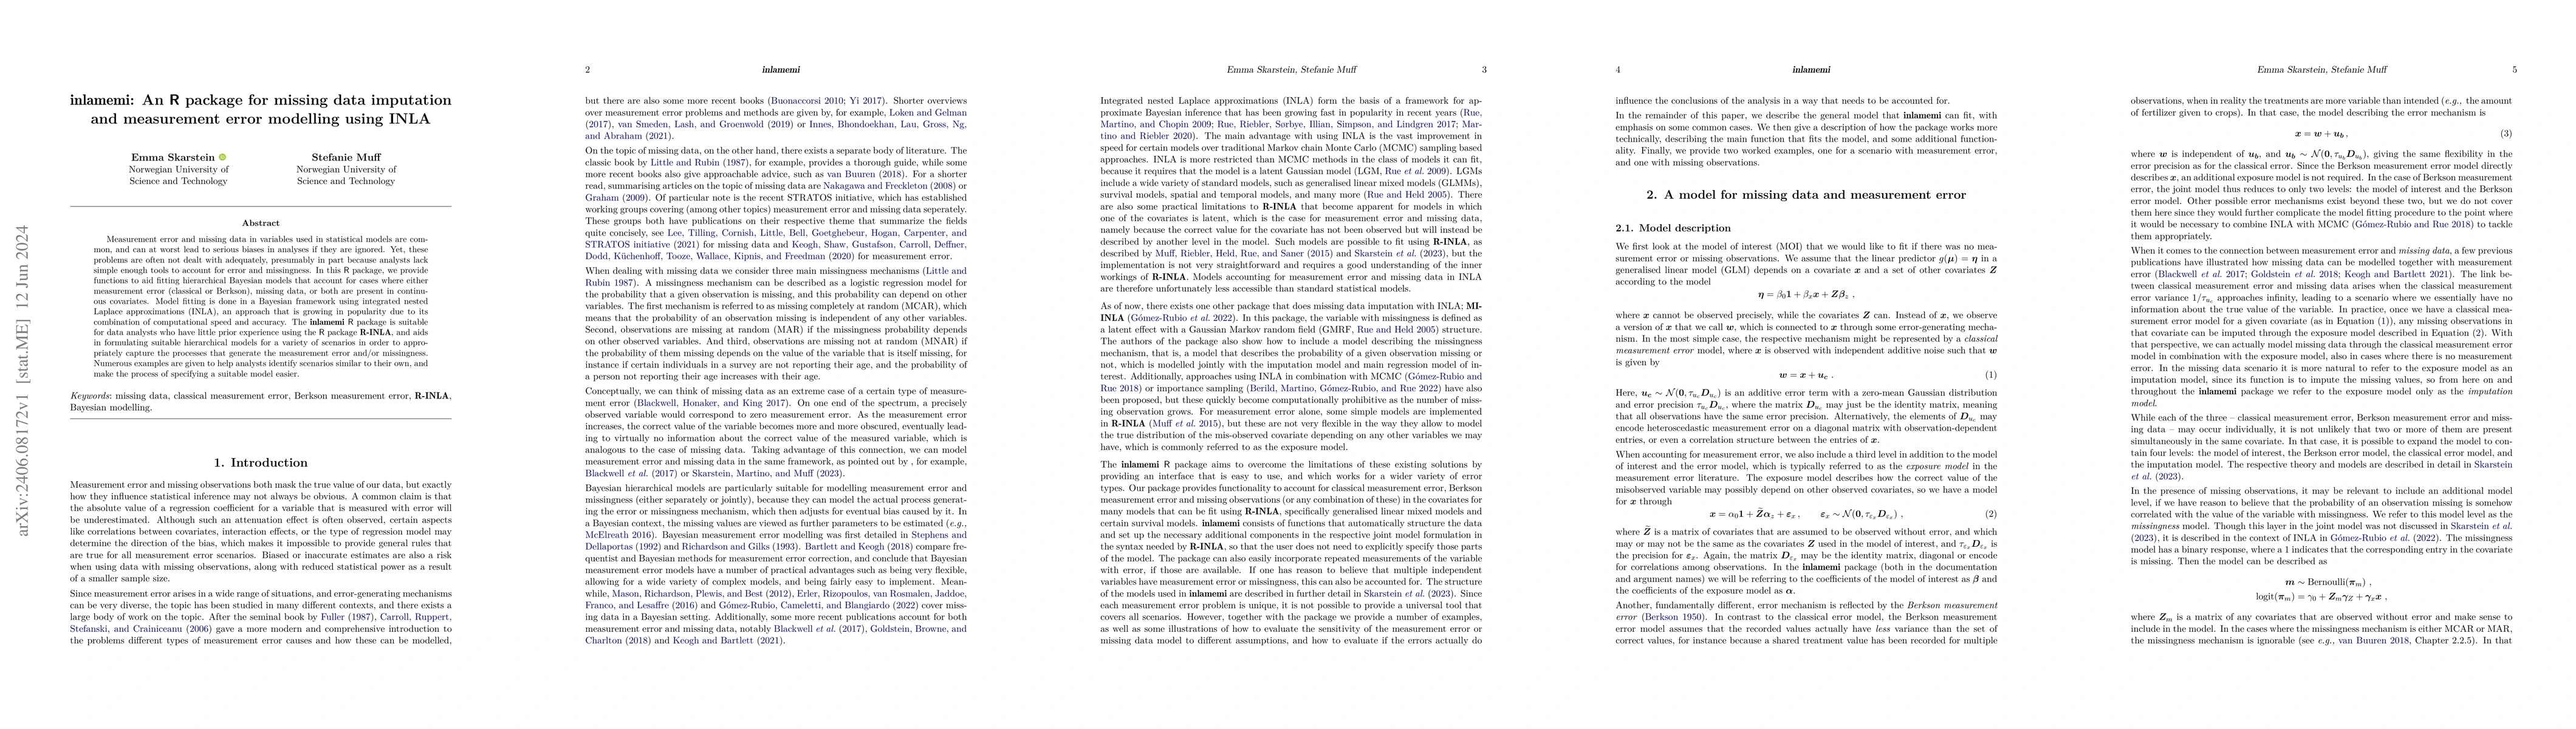
Measurement error and missing data in variables used in statistical models are common, and can at worst lead to serious biases in analyses if they are ignored. Yet, these problems are often not dealt with adequately, presumably in part because analysts lack simple enough tools to account for error and missingness. In this R package, we provide functions to aid fitting hierarchical Bayesian models that account for cases where either measurement error (classical or Berkson), missing data, or both are present in continuous covariates. Model fitting is done in a Bayesian framework using integrated nested Laplace approximations (INLA), an approach that is growing in popularity due to its combination of computational speed and accuracy. The {inlamemi} R package is suitable for data analysts who have little prior experience using the R package {R-INLA}, and aids in formulating suitable hierarchical models for a variety of scenarios in order to appropriately capture the processes that generate the measurement error and/or missingness. Numerous examples are given to help analysts identify scenarios similar to their own, and make the process of specifying a suitable model easier.
AI Key Findings
Get AI-generated insights about this paper's methodology, results, significance, and more — seven facets brought into focus.
Impact
Paper Details
Authors
PDF Preview
Key Terms
Citation Network
Current paper (gray), citations (green), references (blue)
Display is limited for performance on very large graphs.
Discussion 0