Quick Answers
What methodology did the authors use?
A mixed-methods study combining a prototype implementation of the Inline tool (VS Code extension and Node.js server) with a 12-participant debugging task study and semi-structured interviews. More in Methodology →
What are the key results?
All participants completed all five debugging tasks, achieving an average success rate of 87% and an average completion time of 10 minutes. — Participants reported high usability (SUS 79.6) and low workload (NASA‑TLX 28.8) and consistently used inline logs, line highlighting, and expression annotations. More in Key Results →
Why is this work significant?
The study demonstrates that embedding real‑time hardware logs directly in source code, combined with a lightweight expression language, can substantially reduce debugging effort for embedded developers without requiring additional instrumentation. More in Significance →
What are the main limitations?
The C++ parser supports only a subset of Arduino functions and single-file projects, limiting scalability to larger codebases. — The serial‑based log transfer introduces a ~5 ms latency and lacks explicit time ordering, which can hinder precise temporal debugging. More in Limitations →
Paper Preview
Abstract
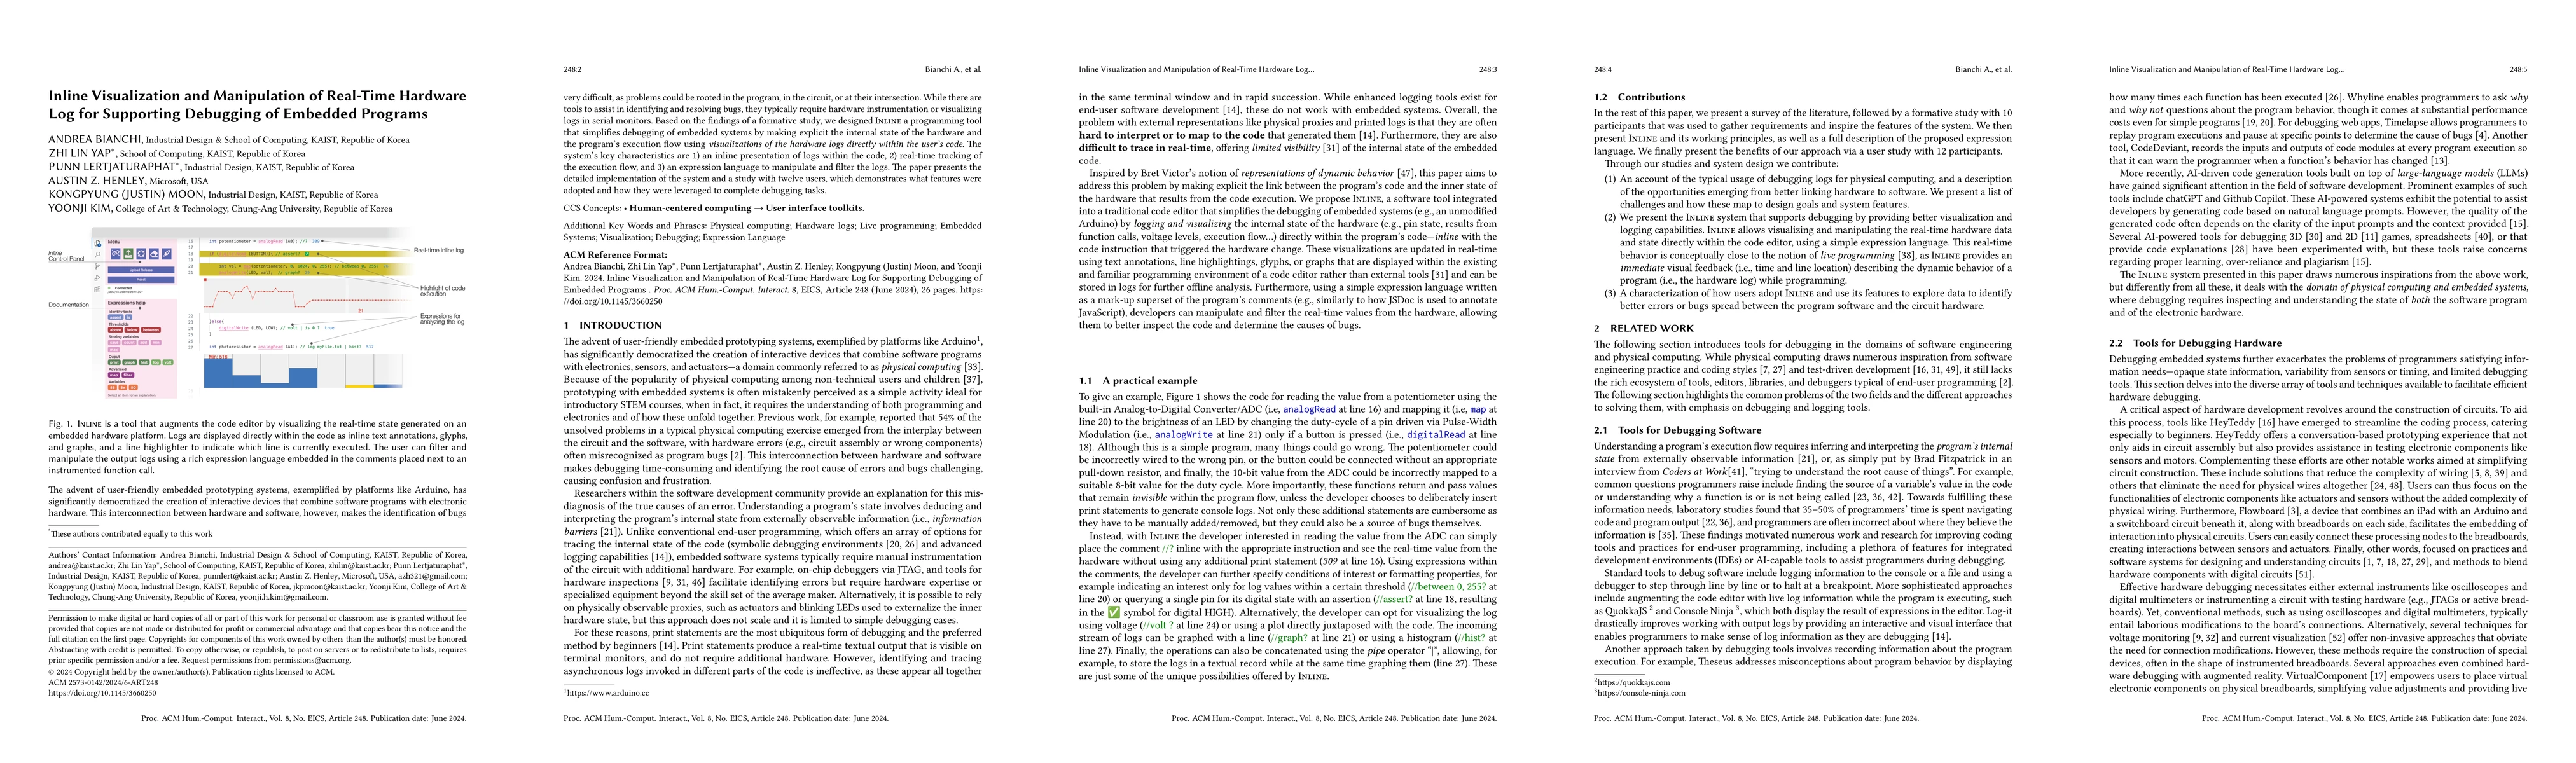
The development of user-friendly embedded prototyping systems like Arduino has made creating interactive devices more accessible. However, debugging these systems is challenging due to the intertwined nature of software and hardware issues. Existing tools often require hardware instrumentation or log visualization through serial monitors. To address this, the authors designed Inline, a programming tool that simplifies debugging by displaying hardware logs directly within the code, providing real-time execution flow tracking and an expression language for log manipulation. A study with twelve users demonstrated the tool's effectiveness in aiding debugging tasks.
AI Key Findings
Generated Mar 05, 2026
Methodology — What approach did the authors take?
A mixed-methods study combining a prototype implementation of the Inline tool (VS Code extension and Node.js server) with a 12-participant debugging task study and semi-structured interviews.
Key Results — What are the main findings?
- All participants completed all five debugging tasks, achieving an average success rate of 87% and an average completion time of 10 minutes.
- Participants reported high usability (SUS 79.6) and low workload (NASA‑TLX 28.8) and consistently used inline logs, line highlighting, and expression annotations.
- Graphical visualizations (histograms and line graphs) were universally adopted and helped users identify sensor ranges, mis‑wired components, and execution branches.
Significance — Why does this research matter?
The study demonstrates that embedding real‑time hardware logs directly in source code, combined with a lightweight expression language, can substantially reduce debugging effort for embedded developers without requiring additional instrumentation.
Technical Contribution — What is the technical contribution?
A VS Code extension that instruments Arduino code, streams metadata‑rich logs over WebSockets, and renders inline textual, glyph, and graphical visualizations driven by a custom expression language.
Novelty — What is new about this work?
Inline is the first software‑only, in‑situ debugging tool that visualizes hardware logs directly beside the source code in real time, enabling developers to trace execution flow and manipulate logs without extra hardware or external consoles.
Limitations — What are the limitations of this study?
- The C++ parser supports only a subset of Arduino functions and single-file projects, limiting scalability to larger codebases.
- The serial‑based log transfer introduces a ~5 ms latency and lacks explicit time ordering, which can hinder precise temporal debugging.
Future Work — What did the authors propose for future work?
- Extend the parser to full C++ and multi‑file projects using incremental parsing (e.g., Tree‑sitter) and support other embedded languages such as MicroPython.
- Integrate Inline with existing hardware debugging frameworks (e.g., JTAG, OpenOCD) and conduct a broader field study across diverse maker communities.
Paper Details
How to Cite This Paper
@article{bianchi2026inline,
  title         = {Inline Visualization and Manipulation of Real-Time Hardware Log for Supporting Debugging of Embedded Programs},
  author        = {Bianchi, Andrea and Henley, Austin Z. and Moon, Kongpyung Justin and others},
  year          = {2026},
  eprint        = {2603.03605},
  archivePrefix = {arXiv},
  primaryClass  = {cs.HC},
  doi           = {10.1145/3660250},
}Bianchi, A., Henley, A., Moon, K., Lertjaturaphat, P., Kim, Y., & Yap, Z. (2026). Inline Visualization and Manipulation of Real-Time Hardware Log for Supporting Debugging of Embedded Programs. arXiv. https://doi.org/10.1145/3660250Bianchi, Andrea, et al. "Inline Visualization and Manipulation of Real-Time Hardware Log for Supporting Debugging of Embedded Programs." arXiv, 2026, doi.org/10.1145/3660250.PDF Preview
Similar Papers
Found 4 papersMìmir: A real-time interactive visualization library for CUDA programs
Francisco Carter, Nancy Hitschfeld, Cristóbal A. Navarro
Comments (0)