InsigHTable: Insight-driven Hierarchical Table Visualization with Reinforcement Learning
Publication
Metrics
AI Quick Summary
InsigHTable is an insight-driven hierarchical table visualization system that uses reinforcement learning to automate the construction of hierarchical table visualizations, reducing cognitive load and improving data insight discovery. The system was validated through experiments showing its effectiveness in aiding users in creating visualizations and uncovering data insights.
Paper Preview
Abstract
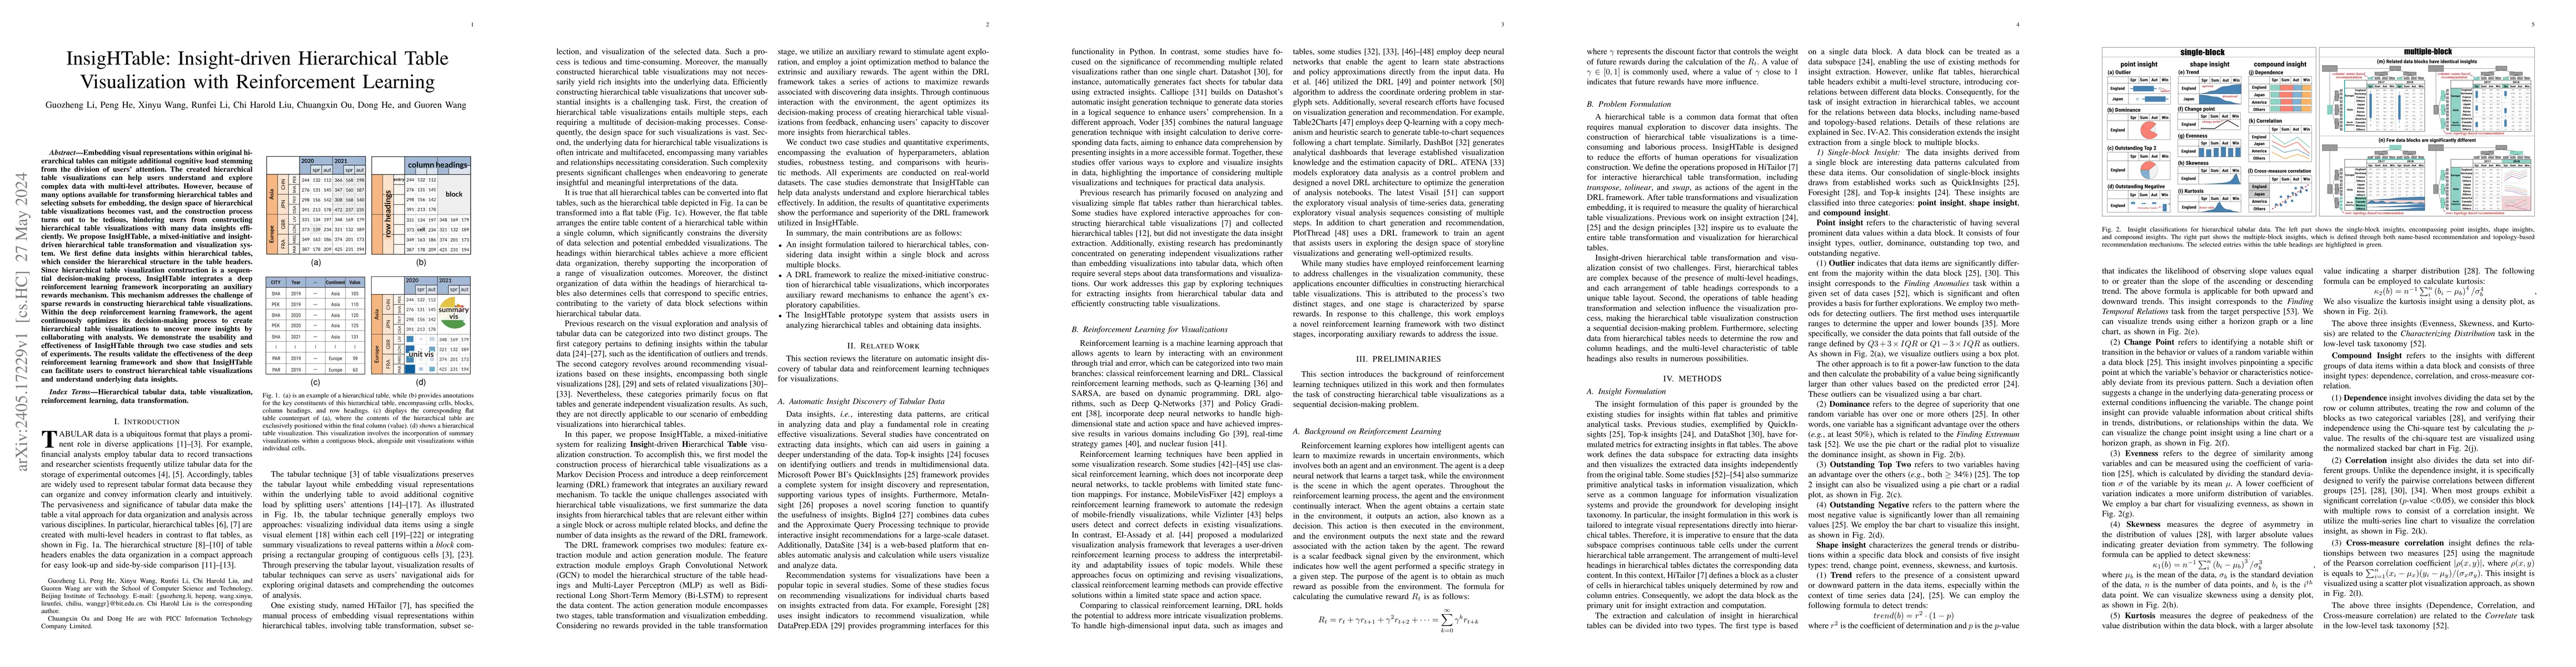
Embedding visual representations within original hierarchical tables can mitigate additional cognitive load stemming from the division of users' attention. The created hierarchical table visualizations can help users understand and explore complex data with multi-level attributes. However, because of many options available for transforming hierarchical tables and selecting subsets for embedding, the design space of hierarchical table visualizations becomes vast, and the construction process turns out to be tedious, hindering users from constructing hierarchical table visualizations with many data insights efficiently. We propose InsigHTable, a mixed-initiative and insight-driven hierarchical table transformation and visualization system. We first define data insights within hierarchical tables, which consider the hierarchical structure in the table headers. Since hierarchical table visualization construction is a sequential decision-making process, InsigHTable integrates a deep reinforcement learning framework incorporating an auxiliary rewards mechanism. This mechanism addresses the challenge of sparse rewards in constructing hierarchical table visualizations. Within the deep reinforcement learning framework, the agent continuously optimizes its decision-making process to create hierarchical table visualizations to uncover more insights by collaborating with analysts. We demonstrate the usability and effectiveness of InsigHTable through two case studies and sets of experiments. The results validate the effectiveness of the deep reinforcement learning framework and show that InsigHTable can facilitate users to construct hierarchical table visualizations and understand underlying data insights.
AI Key Findings
Get AI-generated insights about this paper's methodology, results, significance, and more — seven facets brought into focus.
Impact
Paper Details
Authors
PDF Preview
Key Terms
Citation Network
Current paper (gray), citations (green), references (blue)
Display is limited for performance on very large graphs.
Discussion 0