Inspecting the Process of Bank Credit Rating via Visual Analytics
Publication
Metrics
AI Quick Summary
The paper introduces RatingVis, a visual analytics tool to help domain experts explore and compare bank credit rating schemes, addressing the lack of understanding in current models by incorporating interactive weight inference and considering bank types. Expert feedback indicates that RatingVis enhances comprehension of different rating schemes.
Paper Preview
Abstract
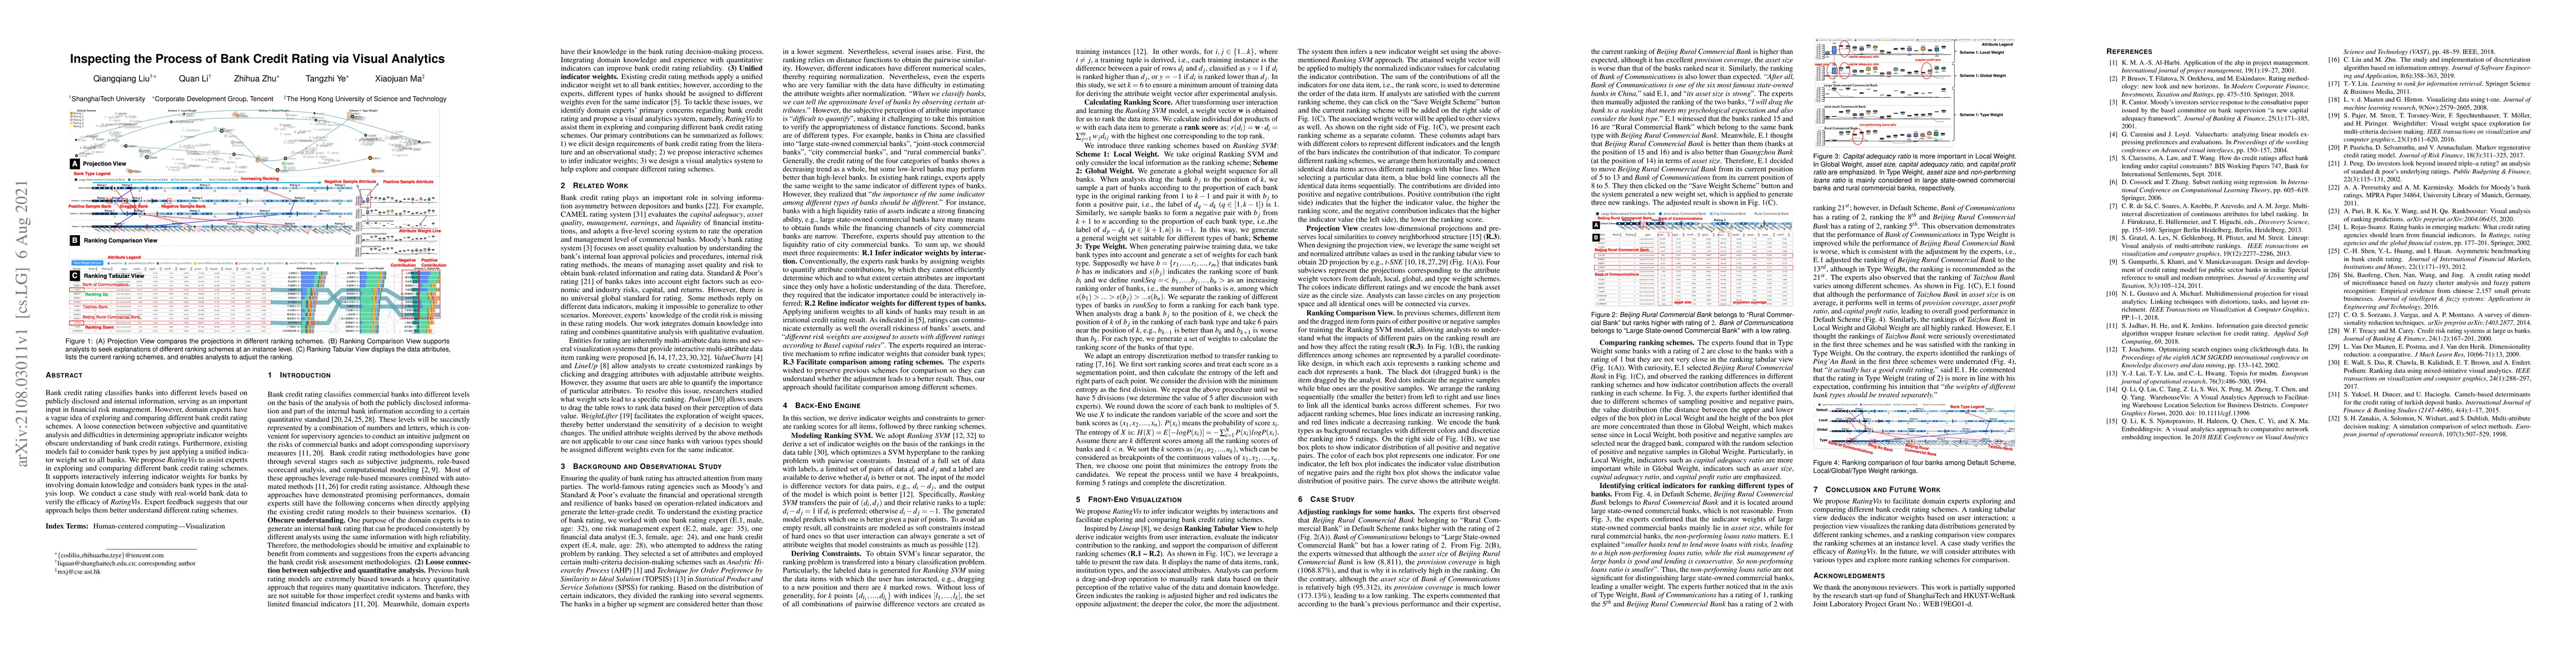
Bank credit rating classifies banks into different levels based on publicly disclosed and internal information, serving as an important input in financial risk management. However, domain experts have a vague idea of exploring and comparing different bank credit rating schemes. A loose connection between subjective and quantitative analysis and difficulties in determining appropriate indicator weights obscure understanding of bank credit ratings. Furthermore, existing models fail to consider bank types by just applying a unified indicator weight set to all banks. We propose RatingVis to assist experts in exploring and comparing different bank credit rating schemes. It supports interactively inferring indicator weights for banks by involving domain knowledge and considers bank types in the analysis loop. We conduct a case study with real-world bank data to verify the efficacy of RatingVis. Expert feedback suggests that our approach helps them better understand different rating schemes.
AI Key Findings
Get AI-generated insights about this paper's methodology, results, significance, and more — seven facets brought into focus.
Impact
Paper Details
Authors
PDF Preview
Key Terms
Citation Network
Current paper (gray), citations (green), references (blue)
Display is limited for performance on very large graphs.
Discussion 0