Summary
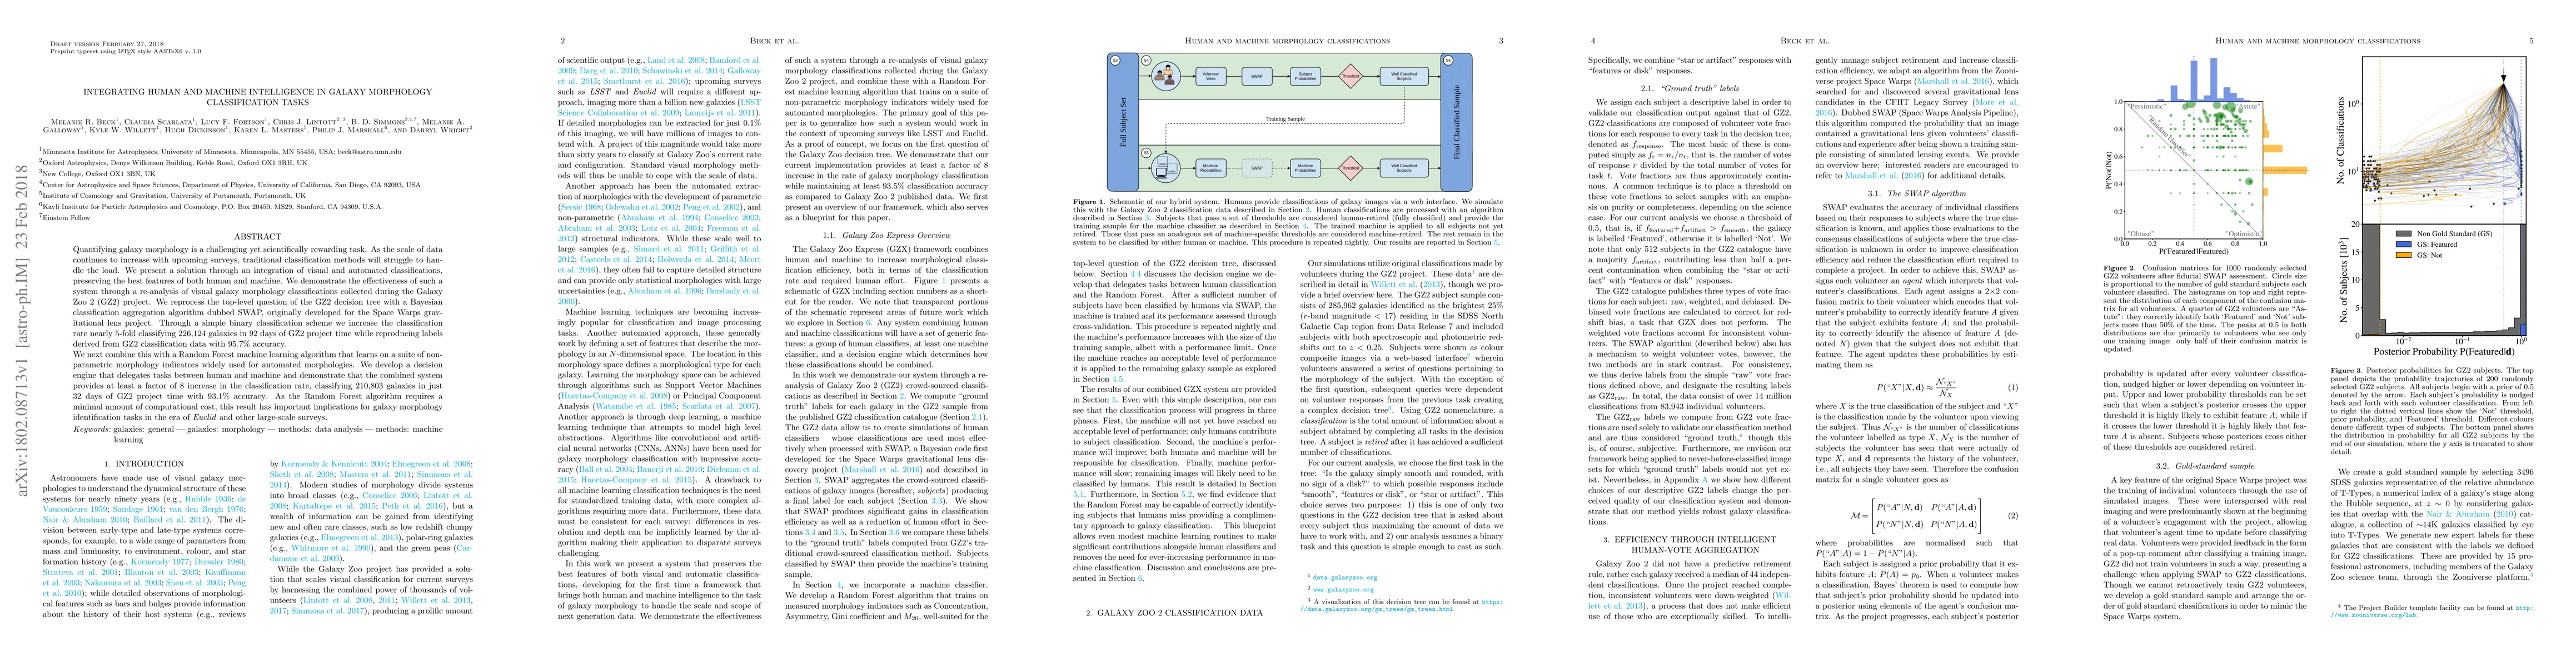
Quantifying galaxy morphology is a challenging yet scientifically rewarding task. As the scale of data continues to increase with upcoming surveys, traditional classification methods will struggle to handle the load. We present a solution through an integration of visual and automated classifications, preserving the best features of both human and machine. We demonstrate the effectiveness of such a system through a re-analysis of visual galaxy morphology classifications collected during the Galaxy Zoo 2 (GZ2) project. We reprocess the top level question of the GZ2 decision tree with a Bayesian classification aggregation algorithm dubbed SWAP, originally developed for the Space Warps gravitational lens project. Through a simple binary classification scheme we increase the classification rate nearly 5-fold, classifying 226,124 galaxies in 92 days of GZ2 project time while reproducing labels derived from GZ2 classification data with 95.7% accuracy. We next combine this with a Random Forest machine learning algorithm that learns on a suite of nonparametric morphology indicators widely used for automated morphologies. We develop a decision engine that delegates tasks between human and machine, and demonstrate that the combined system provides at least a factor of 8 increase in the classification rate, classifying 210,803 galaxies in just 32 days of GZ2 project time with 93.1% accuracy. As the Random Forest algorithm requires a minimal amount of computation cost, this result has important implications for galaxy morphology identification tasks in the era of Euclid and other large scale surveys.
AI Key Findings
Get AI-generated insights about this paper's methodology, results, and significance.
Paper Details
PDF Preview
Key Terms
Citation Network
Current paper (gray), citations (green), references (blue)
Display is limited for performance on very large graphs.
| Title | Authors | Year | Actions |
|---|
Comments (0)