Interactive Classification Metrics: A graphical application to build robust intuition for classification model evaluation
Publication
Metrics
AI Quick Summary
This paper introduces Interactive Classification Metrics (ICM), a graphical application designed to visually explore the relationships between various evaluation metrics for binary classification models. The tool aims to help practitioners choose appropriate metrics and foster a deeper understanding of metric interpretations without the need for data preprocessing or model training.
Paper Preview
Abstract
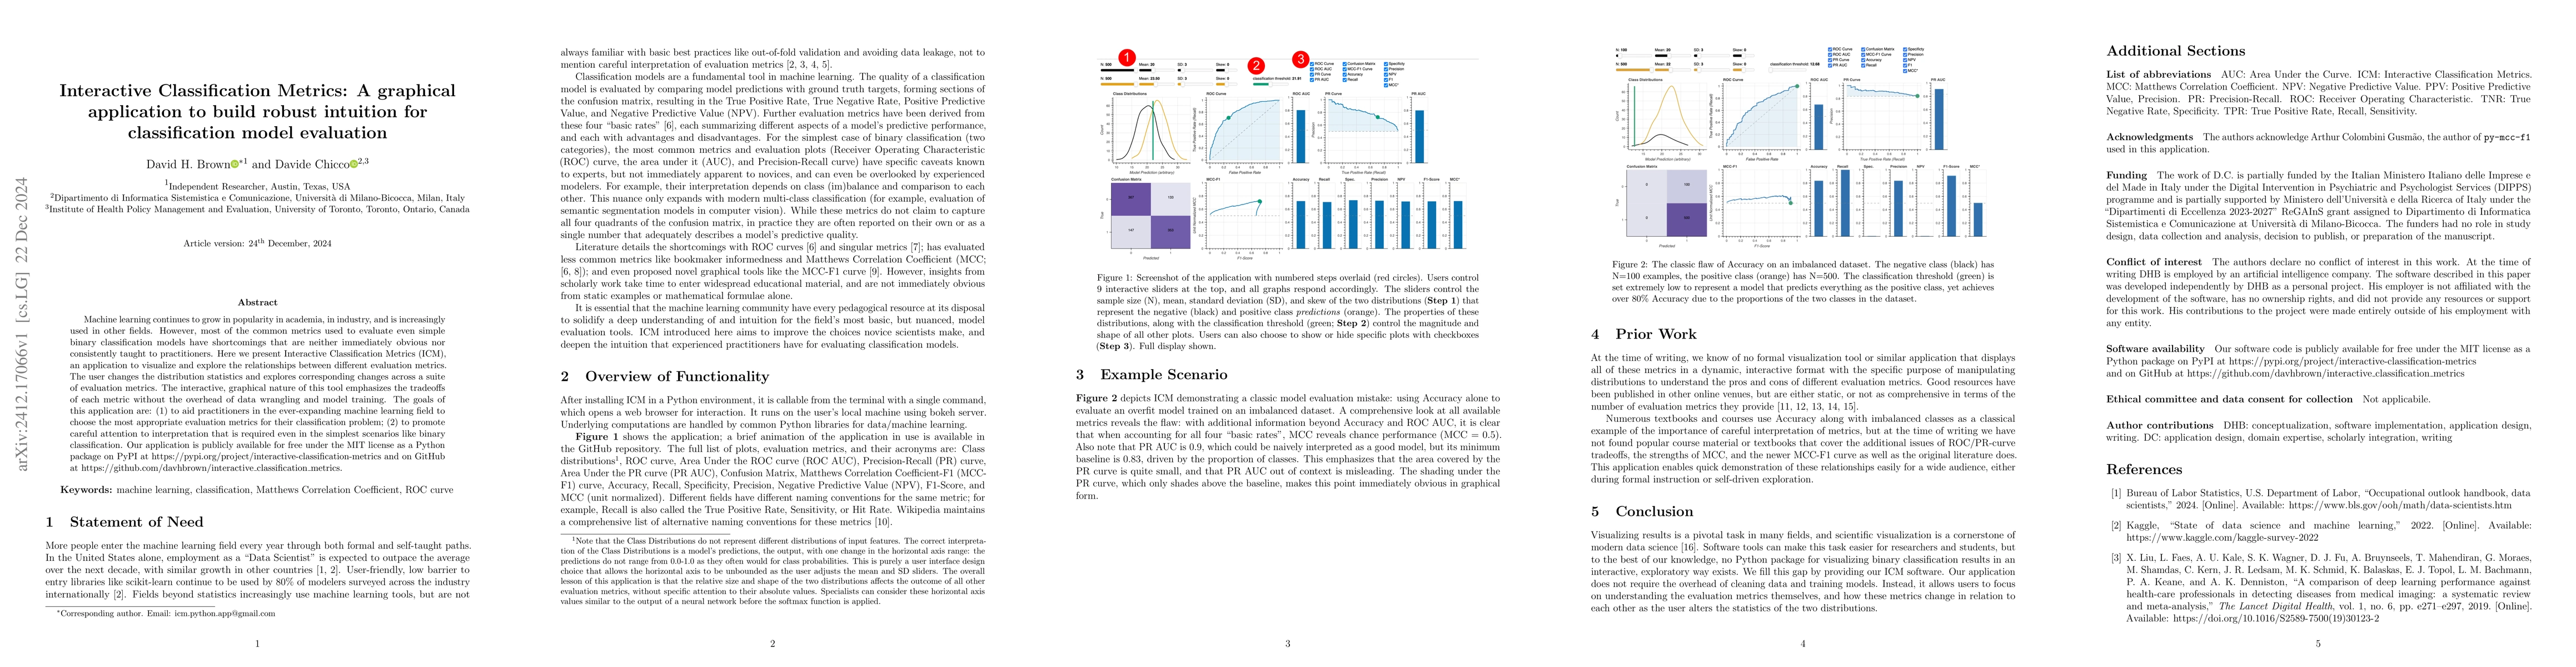
Machine learning continues to grow in popularity in academia, in industry, and is increasingly used in other fields. However, most of the common metrics used to evaluate even simple binary classification models have shortcomings that are neither immediately obvious nor consistently taught to practitioners. Here we present Interactive Classification Metrics (ICM), an application to visualize and explore the relationships between different evaluation metrics. The user changes the distribution statistics and explores corresponding changes across a suite of evaluation metrics. The interactive, graphical nature of this tool emphasizes the tradeoffs of each metric without the overhead of data wrangling and model training. The goals of this application are: (1) to aid practitioners in the ever-expanding machine learning field to choose the most appropriate evaluation metrics for their classification problem; (2) to promote careful attention to interpretation that is required even in the simplest scenarios like binary classification. Our application is publicly available for free under the MIT license as a Python package on PyPI at https://pypi.org/project/interactive-classification-metrics and on GitHub at https://github.com/davhbrown/interactive_classification_metrics.
AI Key Findings
Get AI-generated insights about this paper's methodology, results, significance, and more — seven facets brought into focus.
Impact
Paper Details
Authors
PDF Preview
Citation Network
Current paper (gray), citations (green), references (blue)
Display is limited for performance on very large graphs.
Discussion 0