Interactive cohort exploration for spinocerebellar ataxias using synthetic cohort data for visualization
Publication
Metrics
AI Quick Summary
This paper presents SCAview, an interactive web-based tool for visualizing data on spinocerebellar ataxias (SCAs) using synthetic cohort data. The tool aims to lower the technical barrier for clinicians, enabling easy data exploration with minimal onboarding.
Paper Preview
Abstract
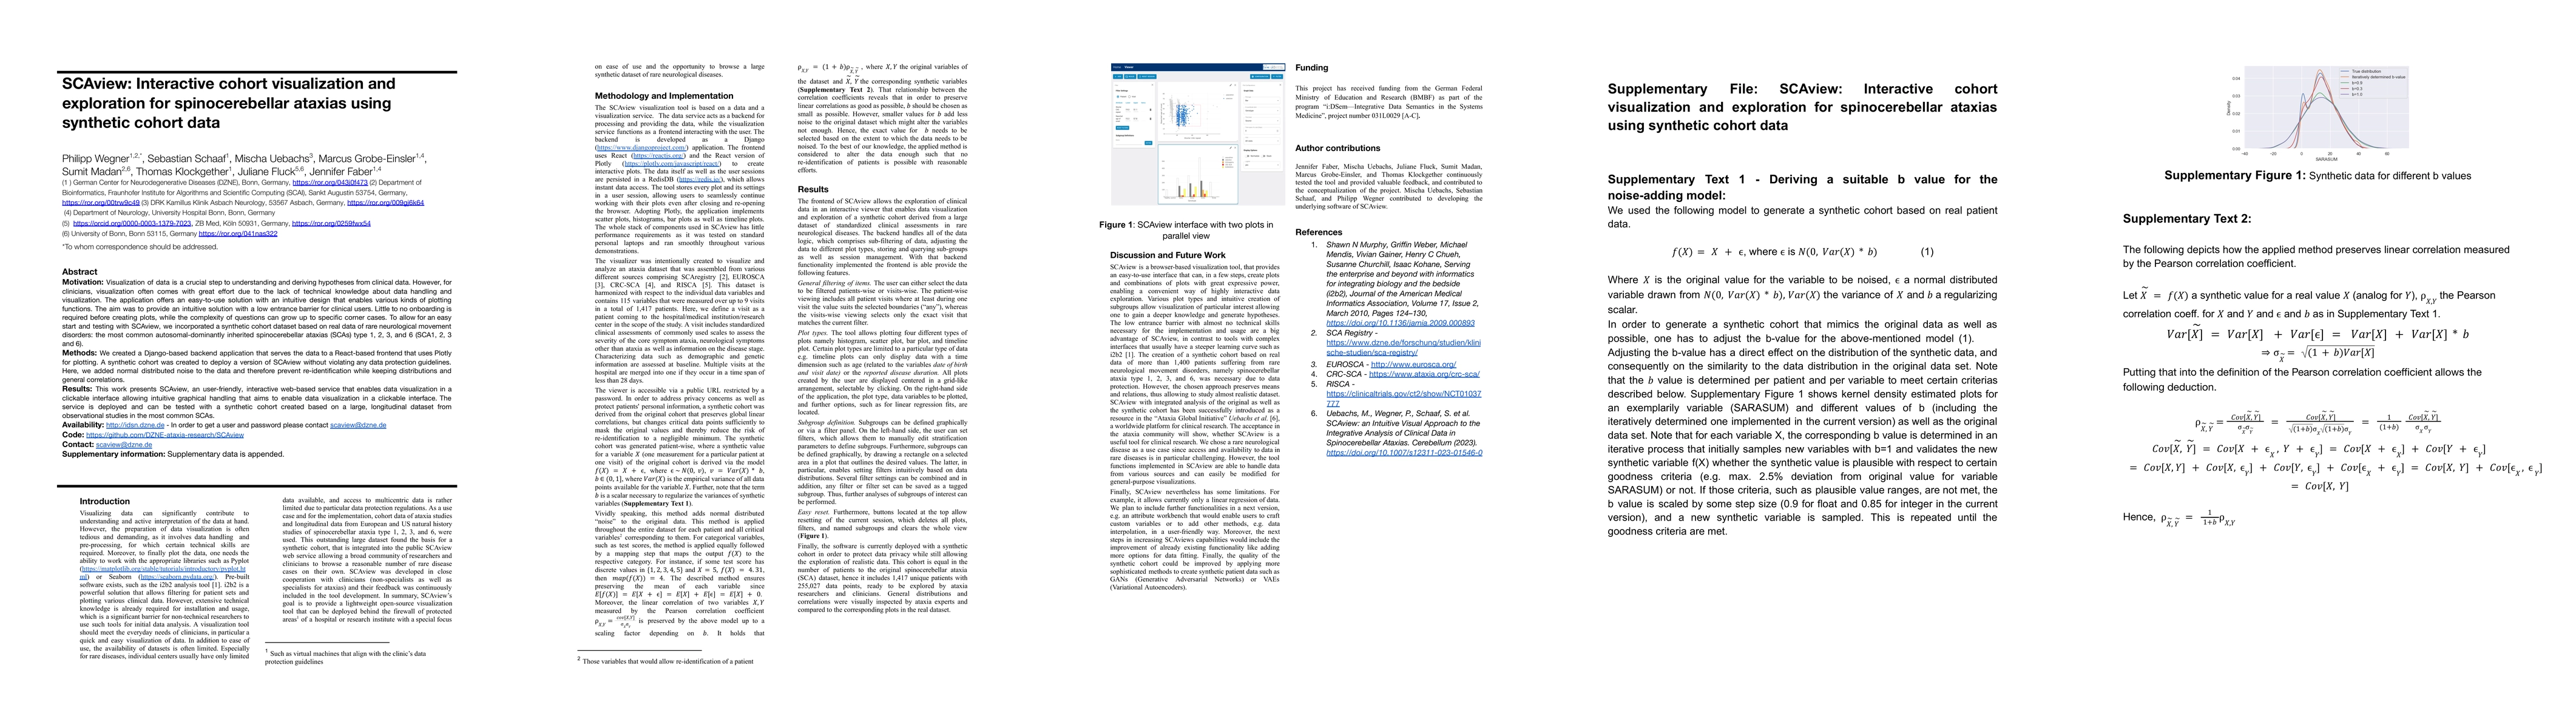
Motivation: Visualization of data is a crucial step to understanding and deriving hypotheses from clinical data. However, for clinicians, visualization often comes with great effort due to the lack of technical knowledge about data handling and visualization. The application offers an easy-to-use solution with an intuitive design that enables various kinds of plotting functions. The aim was to provide an intuitive solution with a low entrance barrier for clinical users. Little to no onboarding is required before creating plots, while the complexity of questions can grow up to specific corner cases. To allow for an easy start and testing with SCAview, we incorporated a synthetic cohort dataset based on real data of rare neurological movement disorders: the most common autosomal-dominantly inherited spinocerebellar ataxias (SCAs) type 1, 2, 3, and 6 (SCA1, 2, 3 and 6). Methods: We created a Django-based backend application that serves the data to a React-based frontend that uses Plotly for plotting. A synthetic cohort was created to deploy a version of SCAview without violating any data protection guidelines. Here, we added normal distributed noise to the data and therefore prevent re-identification while keeping distributions and general correlations. Results: This work presents SCAview, an user-friendly, interactive web-based service that enables data visualization in a clickable interface allowing intuitive graphical handling that aims to enable data visualization in a clickable interface. The service is deployed and can be tested with a synthetic cohort created based on a large, longitudinal dataset from observational studies in the most common SCAs.
AI Key Findings
Get AI-generated insights about this paper's methodology, results, significance, and more — seven facets brought into focus.
Impact
Paper Details
Authors
PDF Preview
Key Terms
Citation Network
Current paper (gray), citations (green), references (blue)
Display is limited for performance on very large graphs.
Discussion 0