Interactive dense pixel visualizations for time series and model attribution explanations
Publication
Metrics
AI Quick Summary
This paper introduces DAVOTS, an interactive visual analytics tool for exploring time series data and neural network model attributions using dense-pixel visualizations. The approach employs clustering and ordering strategies to facilitate pattern discovery in large datasets.
Paper Preview
Abstract
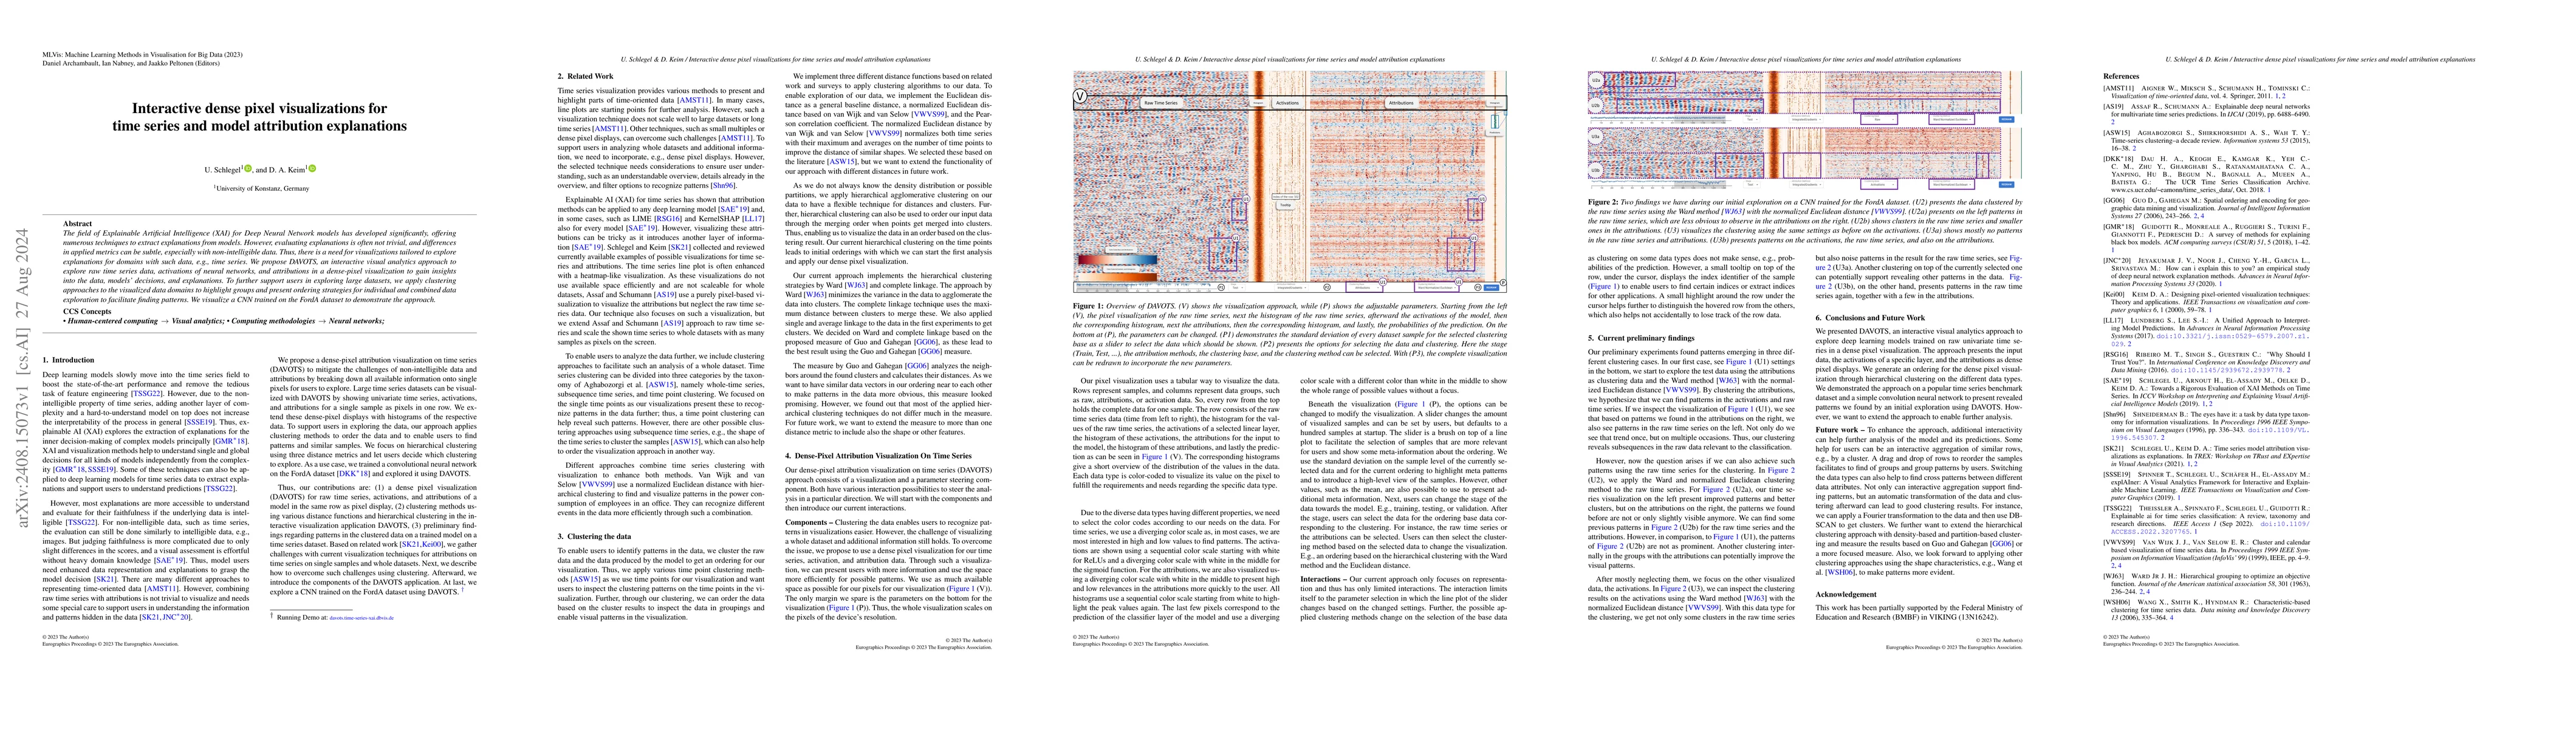
The field of Explainable Artificial Intelligence (XAI) for Deep Neural Network models has developed significantly, offering numerous techniques to extract explanations from models. However, evaluating explanations is often not trivial, and differences in applied metrics can be subtle, especially with non-intelligible data. Thus, there is a need for visualizations tailored to explore explanations for domains with such data, e.g., time series. We propose DAVOTS, an interactive visual analytics approach to explore raw time series data, activations of neural networks, and attributions in a dense-pixel visualization to gain insights into the data, models' decisions, and explanations. To further support users in exploring large datasets, we apply clustering approaches to the visualized data domains to highlight groups and present ordering strategies for individual and combined data exploration to facilitate finding patterns. We visualize a CNN trained on the FordA dataset to demonstrate the approach.
AI Key Findings
Get AI-generated insights about this paper's methodology, results, significance, and more — seven facets brought into focus.
Impact
Paper Details
Authors
PDF Preview
Citation Network
Current paper (gray), citations (green), references (blue)
Display is limited for performance on very large graphs.
Discussion 0