Interactive distributed cloud-based web-server systems for the smart healthcare industry
Publication
Metrics
AI Quick Summary
This research explores interactive cloud-based solutions for smart healthcare, focusing on data visualization and comparative studies of Ray Casting algorithms. It proposes a new method for volume calculation using spheres and parallel processing on graphic accelerators, along with a cloud server architecture for artifact control.
Paper Preview
Abstract
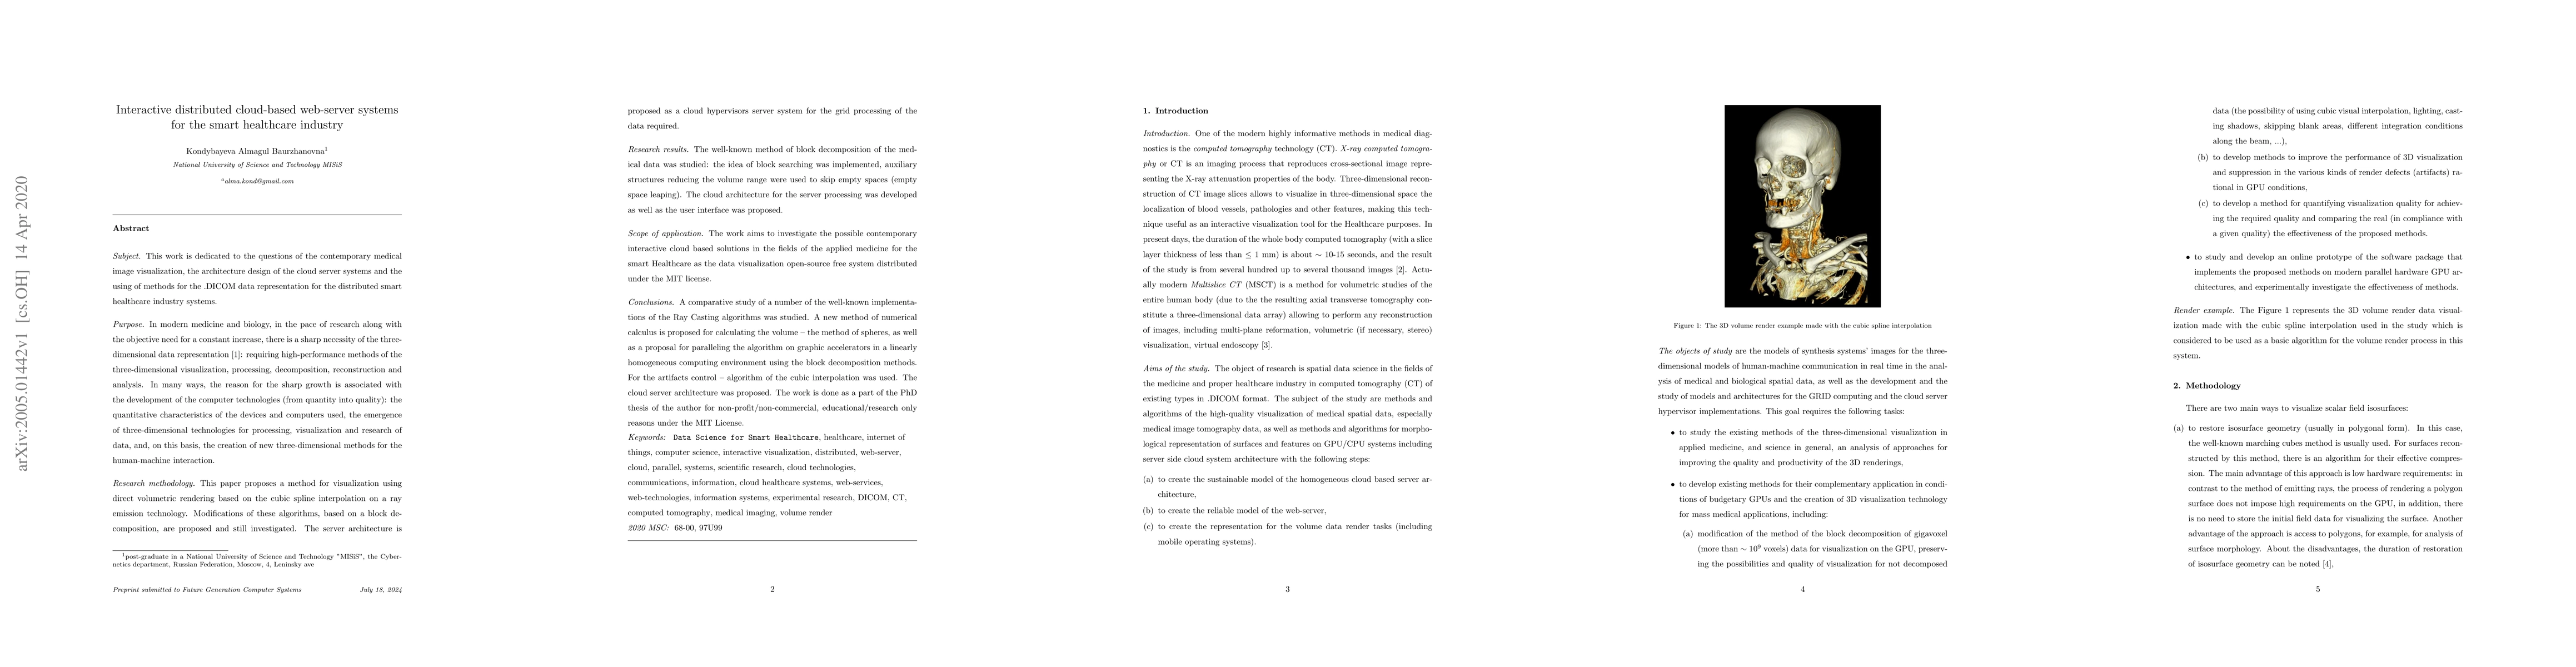
The work aims to investigate the possible contemporary interactive cloud based solutions in the fields of the applied medicine for the smart Healthcare as the data visualization open-source free system distributed under the MIT license. A comparative study of a number of the well-known implementations of the Ray Casting algorithms was studied. A new method of numerical calculus is proposed for calculating the volume -- the method of spheres, as well as a proposal for paralleling the algorithm on graphic accelerators in a linearly homogeneous computing environment using the block decomposition methods. For the artifacts control -- algorithm of the cubic interpolation was used. The cloud server architecture was proposed.
AI Key Findings
Get AI-generated insights about this paper's methodology, results, significance, and more — seven facets brought into focus.
Impact
Paper Details
Authors
PDF Preview
Key Terms
Citation Network
Current paper (gray), citations (green), references (blue)
Display is limited for performance on very large graphs.
Discussion 0