Publication
Metrics
AI Quick Summary
This paper presents interactive scalable vector graphics maps to visualize daily nucleotide variations in SARS-CoV-2 genomes across six continents, providing insights into the virus's rapid evolution and mutation patterns compared to the initial strain. The mutation time maps are publicly accessible for further exploration.
Paper Preview
Abstract
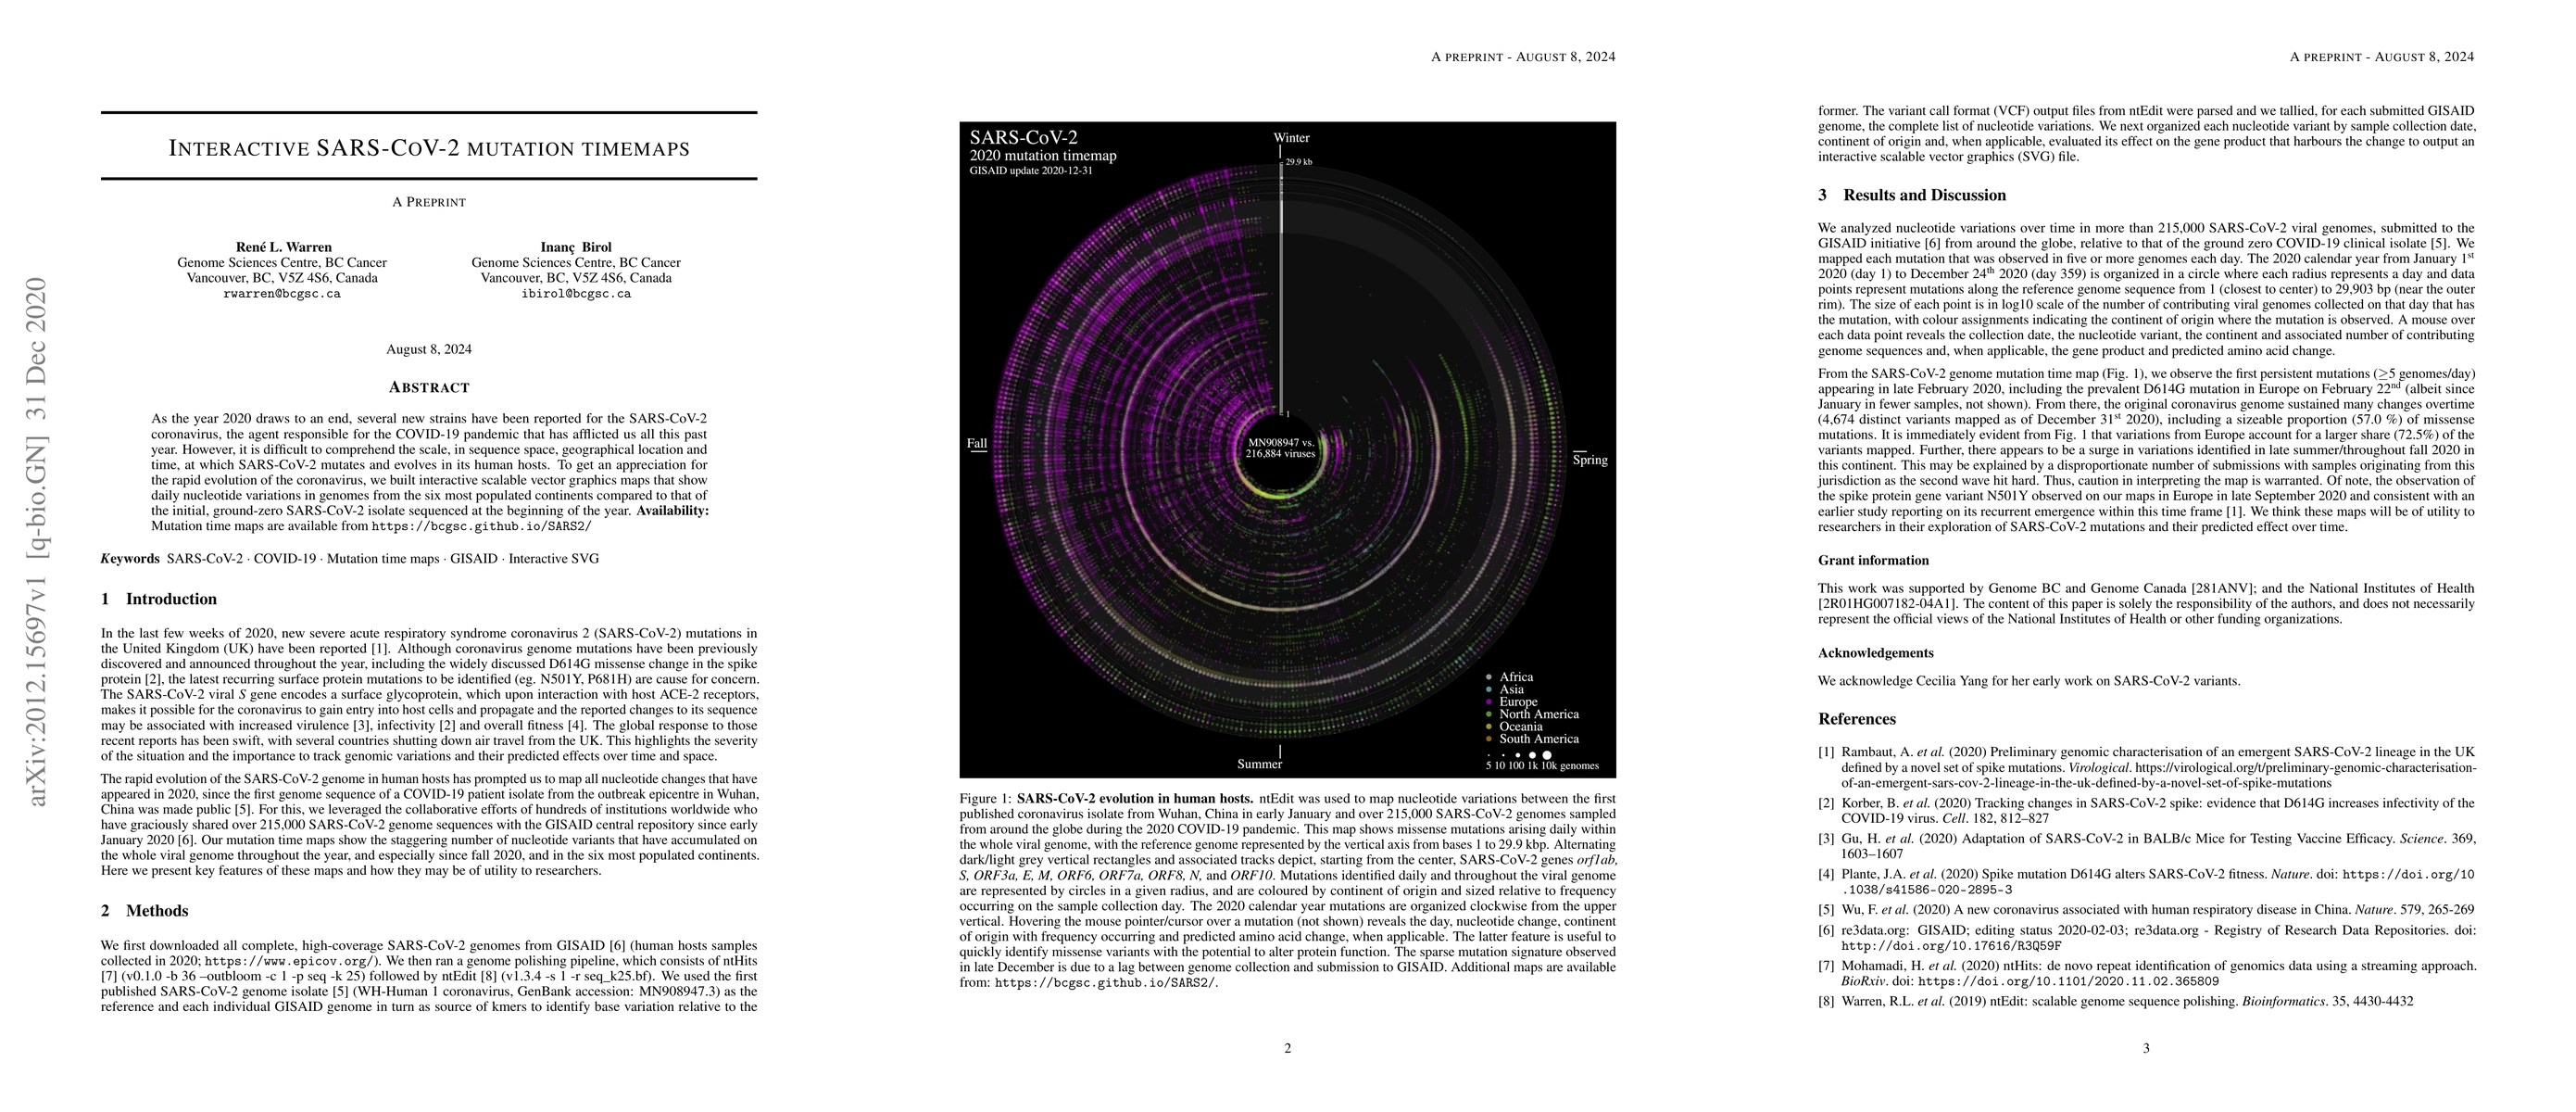
As the year 2020 draws to an end, several new strains have been reported for the SARS-CoV-2 coronavirus, the agent responsible for the COVID-19 pandemic that has afflicted us all this past year. However, it is difficult to comprehend the scale, in sequence space, geographical location and time, at which SARS-CoV-2 mutates and evolves in its human hosts. To get an appreciation for the rapid evolution of the coronavirus, we built interactive scalable vector graphics maps that show daily nucleotide variations in genomes from the six most populated continents compared to that of the initial, ground-zero SARS-CoV-2 isolate sequenced at the beginning of the year. Availability: Mutation time maps are available from https://bcgsc.github.io/SARS2/
AI Key Findings
Get AI-generated insights about this paper's methodology, results, significance, and more — seven facets brought into focus.
Impact
Paper Details
Authors
PDF Preview
Key Terms
Citation Network
Current paper (gray), citations (green), references (blue)
Display is limited for performance on very large graphs.
Discussion 0