Interactive Sensor Dashboard for Smart Manufacturing
Publication
Metrics
Paper Preview
Abstract
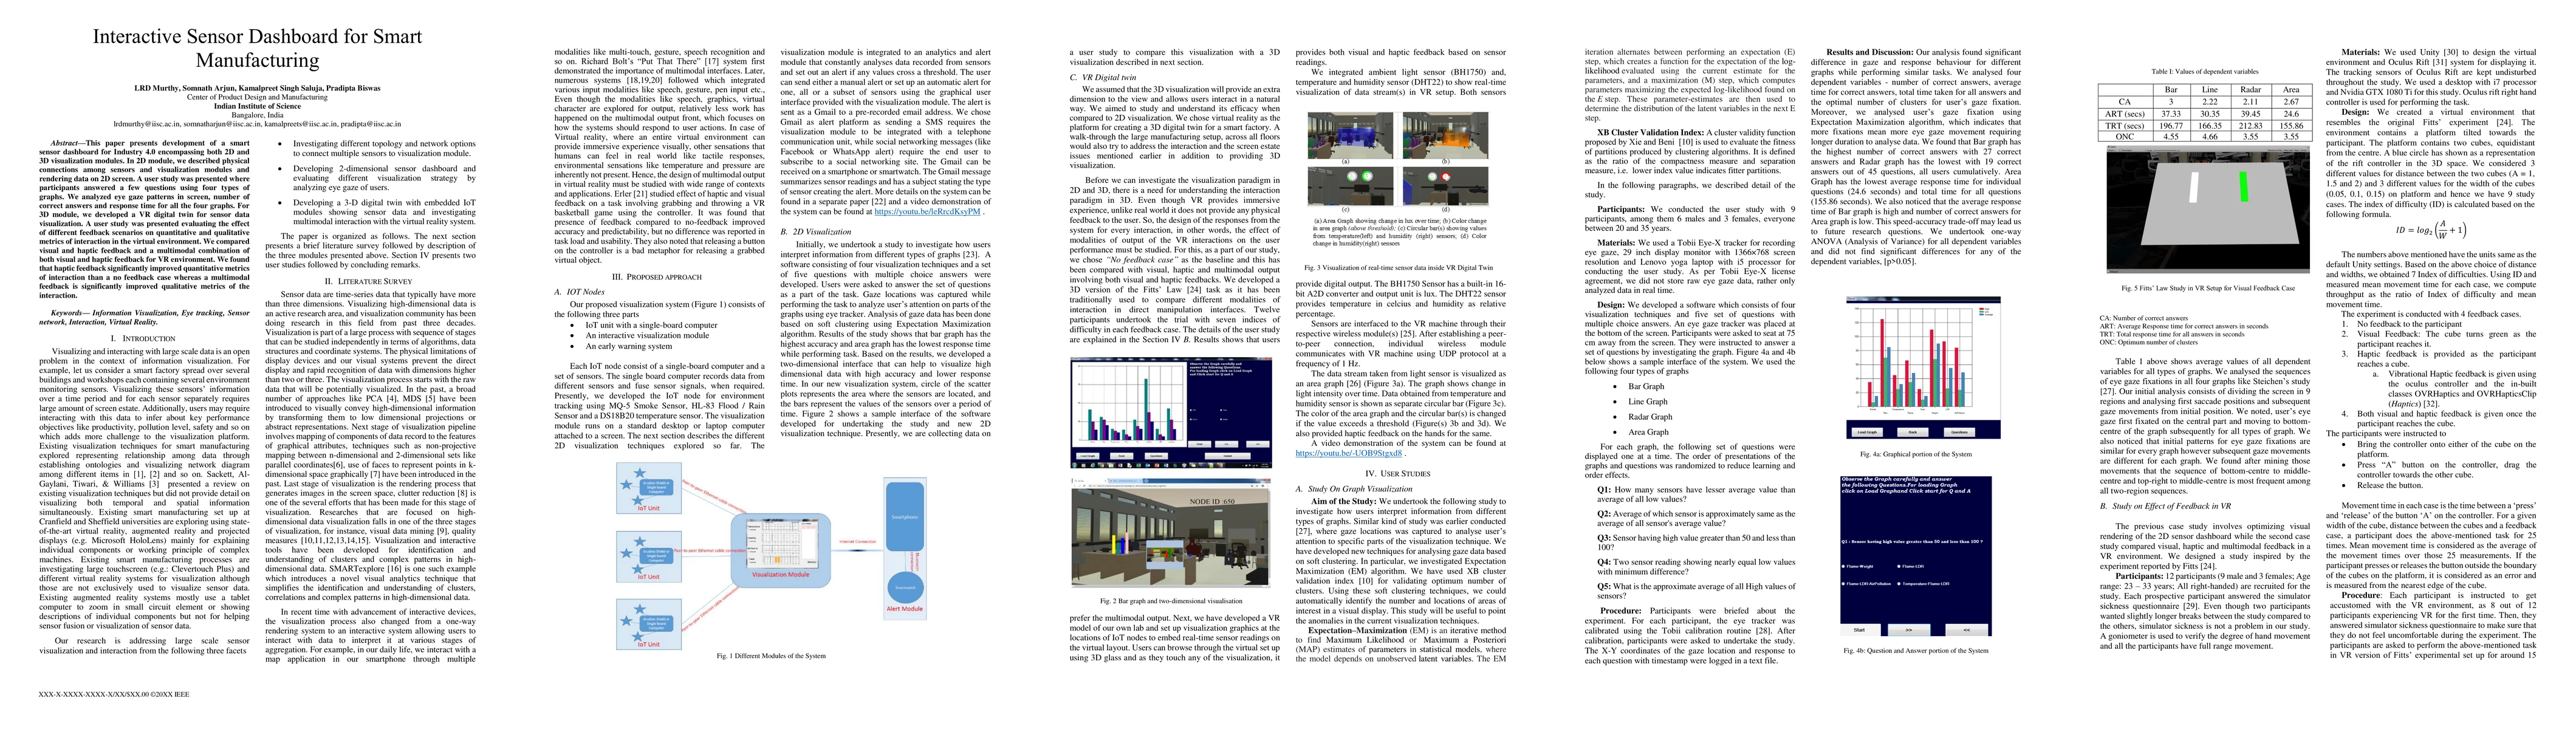
This paper presents development of a smart sensor dashboard for Industry 4.0 encompassing both 2D and 3D visualization modules. In 2D module, we described physical connections among sensors and visualization modules and rendering data on 2D screen. A user study was presented where participants answered a few questions using four types of graphs. We analyzed eye gaze patterns in screen, number of correct answers and response time for all the four graphs. For 3D module, we developed a VR digital twin for sensor data visualization. A user study was presented evaluating the effect of different feedback scenarios on quantitative and qualitative metrics of interaction in the virtual environment. We compared visual and haptic feedback and a multimodal combination of both visual and haptic feedback for VR environment. We found that haptic feedback significantly improved quantitative metrics of interaction than a no feedback case whereas a multimodal feedback is significantly improved qualitative metrics of the interaction.
AI Key Findings
Get AI-generated insights about this paper's methodology, results, significance, and more — seven facets brought into focus.
Impact
Paper Details
Authors
PDF Preview
Key Terms
Citation Network
Current paper (gray), citations (green), references (blue)
Display is limited for performance on very large graphs.
Discussion 0