Interactive Static Software Performance Analysis in the IDE
Publication
Metrics
AI Quick Summary
This research introduces a VSCode tool that uses static performance analysis via Infer, displaying results through annotations and side panel views for easy understanding. It offers interactivity for real-time responsiveness to code changes, introducing minimal overhead in development workflows. An ElasticSearch case study demonstrates its effectiveness in identifying performance bugs.
Paper Preview
Abstract
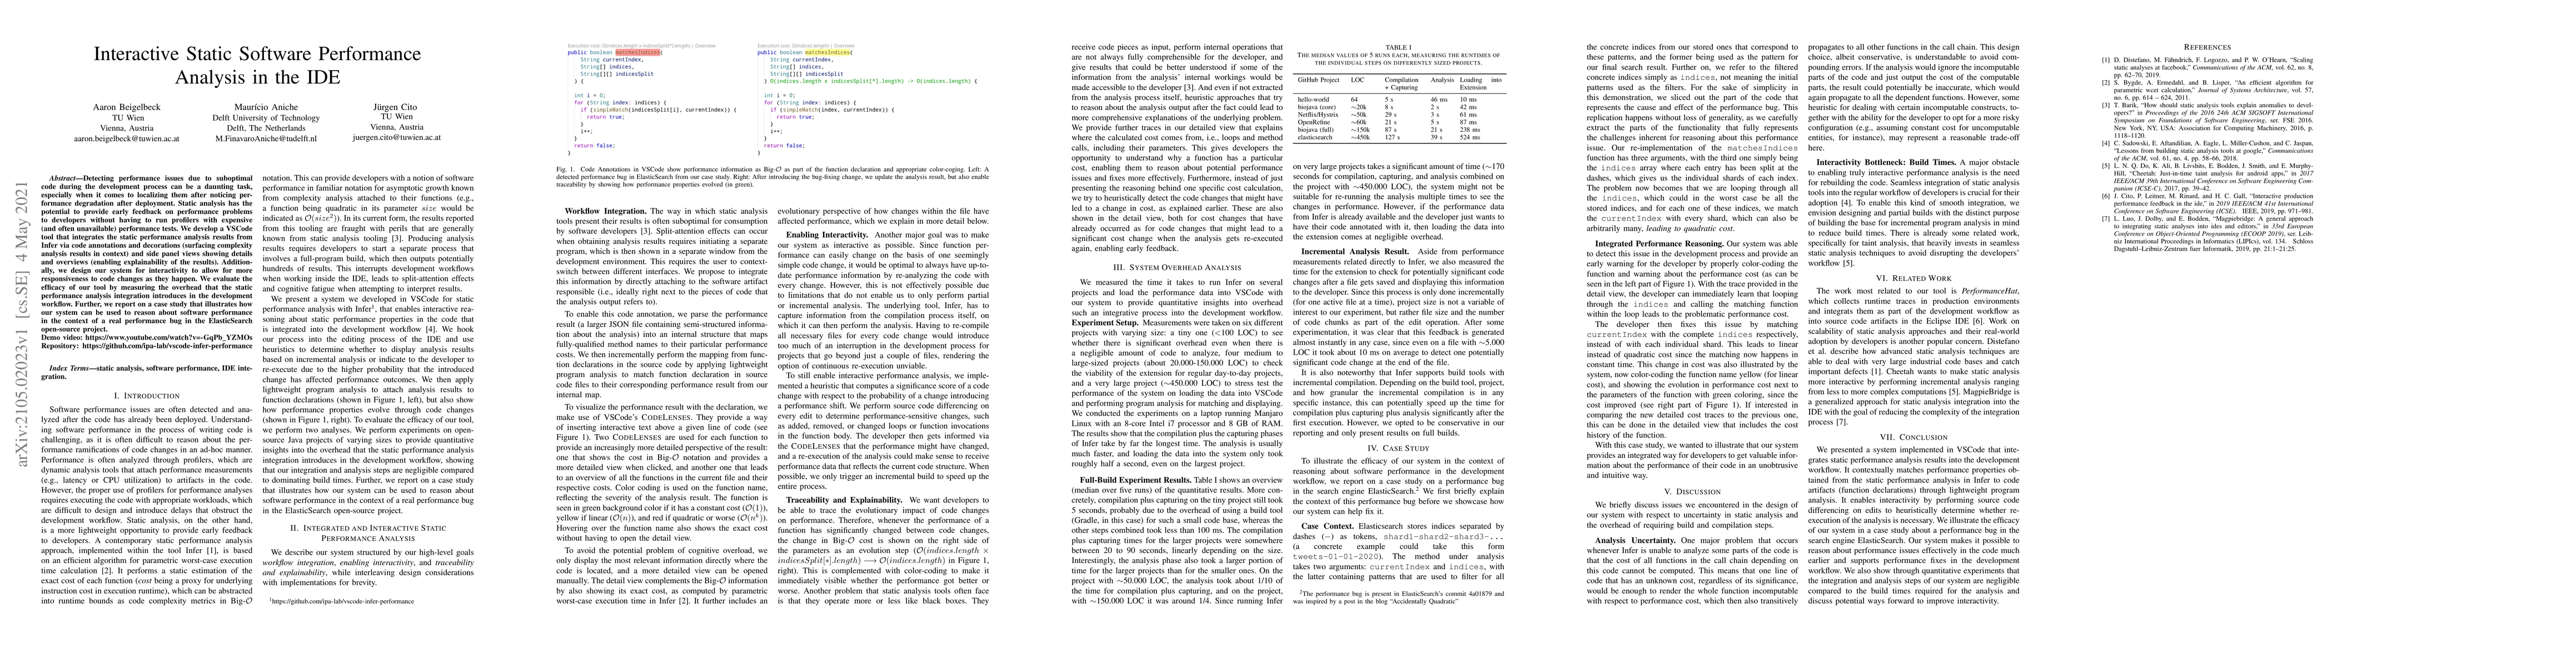
Detecting performance issues due to suboptimal code during the development process can be a daunting task, especially when it comes to localizing them after noticing performance degradation after deployment. Static analysis has the potential to provide early feedback on performance problems to developers without having to run profilers with expensive (and often unavailable) performance tests. We develop a VSCode tool that integrates the static performance analysis results from Infer via code annotations and decorations (surfacing complexity analysis results in context) and side panel views showing details and overviews (enabling explainability of the results). Additionally, we design our system for interactivity to allow for more responsiveness to code changes as they happen. We evaluate the efficacy of our tool by measuring the overhead that the static performance analysis integration introduces in the development workflow. Further, we report on a case study that illustrates how our system can be used to reason about software performance in the context of a real performance bug in the ElasticSearch open-source project. Demo video: https://www.youtube.com/watch?v=-GqPb_YZMOs Repository: https://github.com/ipa-lab/vscode-infer-performance
AI Key Findings
Get AI-generated insights about this paper's methodology, results, significance, and more — seven facets brought into focus.
Impact
Paper Details
Authors
PDF Preview
Key Terms
Citation Network
Current paper (gray), citations (green), references (blue)
Display is limited for performance on very large graphs.
Discussion 0