Interactive Visual Data Exploration with Subjective Feedback: An Information-Theoretic Approach
Publication
Metrics
AI Quick Summary
This research paper presents an information-theoretic approach to interactive visual data exploration that uses user feedback to identify patterns in high-dimensional datasets.
Paper Preview
Abstract
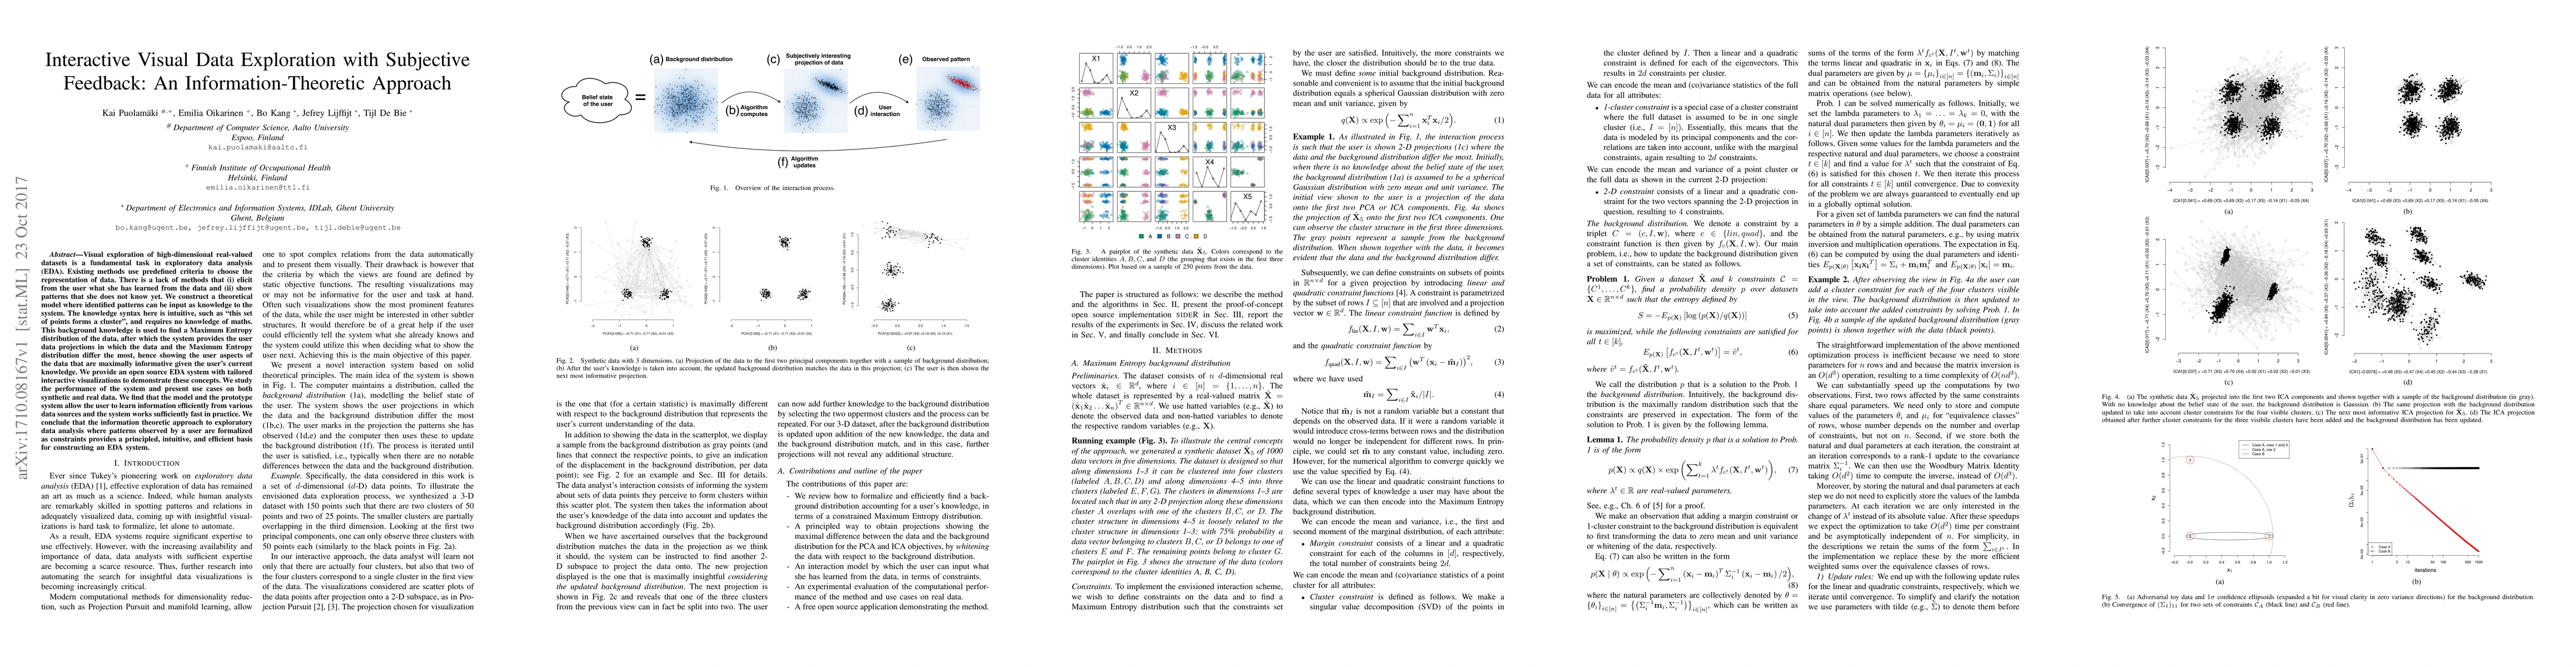
Visual exploration of high-dimensional real-valued datasets is a fundamental task in exploratory data analysis (EDA). Existing methods use predefined criteria to choose the representation of data. There is a lack of methods that (i) elicit from the user what she has learned from the data and (ii) show patterns that she does not know yet. We construct a theoretical model where identified patterns can be input as knowledge to the system. The knowledge syntax here is intuitive, such as "this set of points forms a cluster", and requires no knowledge of maths. This background knowledge is used to find a Maximum Entropy distribution of the data, after which the system provides the user data projections in which the data and the Maximum Entropy distribution differ the most, hence showing the user aspects of the data that are maximally informative given the user's current knowledge. We provide an open source EDA system with tailored interactive visualizations to demonstrate these concepts. We study the performance of the system and present use cases on both synthetic and real data. We find that the model and the prototype system allow the user to learn information efficiently from various data sources and the system works sufficiently fast in practice. We conclude that the information theoretic approach to exploratory data analysis where patterns observed by a user are formalized as constraints provides a principled, intuitive, and efficient basis for constructing an EDA system.
AI Key Findings
Get AI-generated insights about this paper's methodology, results, significance, and more — seven facets brought into focus.
Impact
Paper Details
Authors
PDF Preview
Key Terms
Citation Network
Current paper (gray), citations (green), references (blue)
Display is limited for performance on very large graphs.
Discussion 0