Publication
Metrics
AI Quick Summary
This survey provides a comprehensive overview of interactive data visualization on large high-resolution displays (LHRDs), analyzing their unique benefits and challenges across visualization techniques, interaction methods, evaluation studies, and applications, while also identifying future research opportunities.
Paper Preview
Abstract
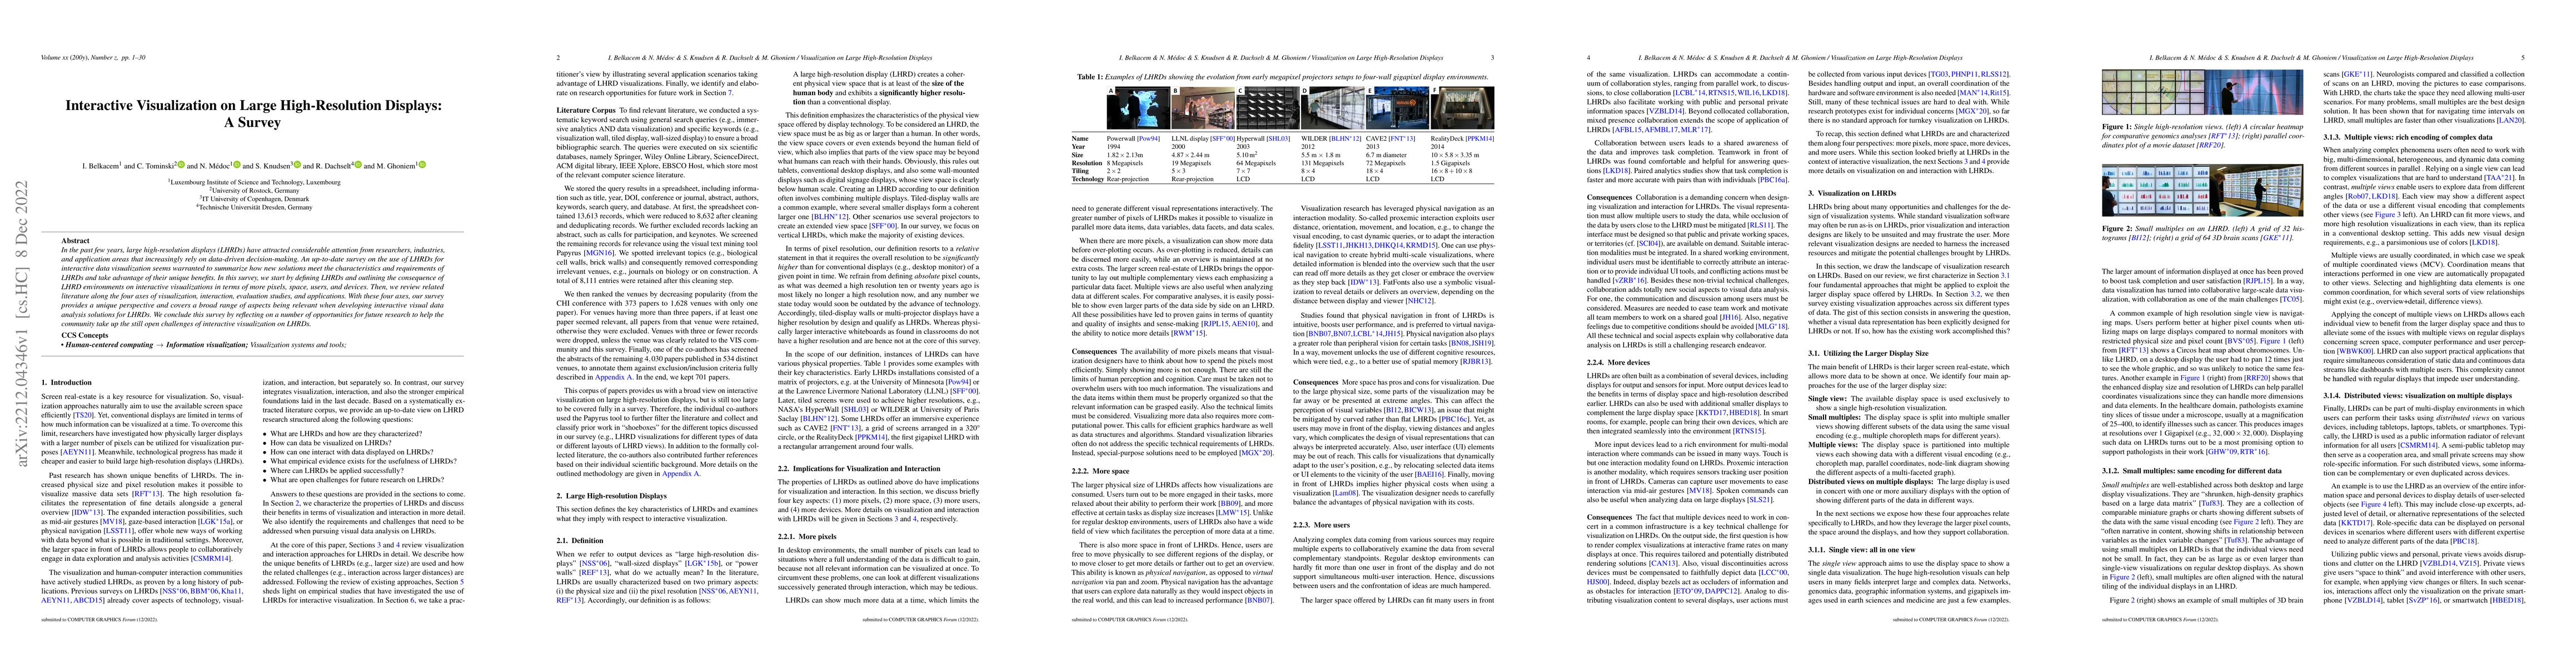
In the past few years, large high-resolution displays (LHRDs) have attracted considerable attention from researchers, industries, and application areas that increasingly rely on data-driven decision-making. An up-to-date survey on the use of LHRDs for interactive data visualization seems warranted to summarize how new solutions meet the characteristics and requirements of LHRDs and take advantage of their unique benefits. In this survey, we start by defining LHRDs and outlining the consequence of LHRD environments on interactive visualizations in terms of more pixels, space, users, and devices. Then, we review related literature along the four axes of visualization, interaction, evaluation studies, and applications. With these four axes, our survey provides a unique perspective and covers a broad range of aspects being relevant when developing interactive visual data analysis solutions for LHRDs. We conclude this survey by reflecting on a number of opportunities for future research to help the community take up the still open challenges of interactive visualization on LHRDs.
AI Key Findings
Get AI-generated insights about this paper's methodology, results, significance, and more — seven facets brought into focus.
Impact
Paper Details
Authors
PDF Preview
Key Terms
Citation Network
Current paper (gray), citations (green), references (blue)
Display is limited for performance on very large graphs.
Discussion 0