ArxivLens

Publication

Published: Jun 11, 2026
Categories: cs.LG, cs.CE

Metrics

Source: ArXiv

Quick Answers

What methodology did the authors use?

An interpretable machine learning pipeline that decomposes cross-sectional equity return predictability into auditable factor contributions, using an XGBoost model with TreeSHAP attribution, rolling 60-month training and 1-month test windows on 3,632 Chinese A-share stocks (2009–2019), with stress testing and ablation analyses to validate feature contributions and interactions. More in Methodology →

What are the key results?

XGBoost achieved an average AUC of 0.547 and a long-short return of +2.38% per month (Newey-West t = 5.94; annualized Sharpe 2.23) across 55 out-of-sample months. — Alpha remained persistent after Carhart four-factor adjustment (+2.31%/month; t = 7.48). More in Key Results →

Why is this work significant?

Demonstrates that interpretable, tree-based models with SHAP attributions can audibly decompose cross-sectional equity return predictability into dominant behavioral factors, providing diagnostic tools for risk-aware decision systems and offering cross-market and cross-industry robustness evidence. More in Significance →

What are the main limitations?

Factor alphas are computed on self-constructed vs. published Chinese factors, introducing potential construct validity concerns. — Look-ahead bias is bounded but present due to data merging without publication lag; survivorship bias remains due to stock universe constraints. More in Limitations →

Paper Preview

Abstract

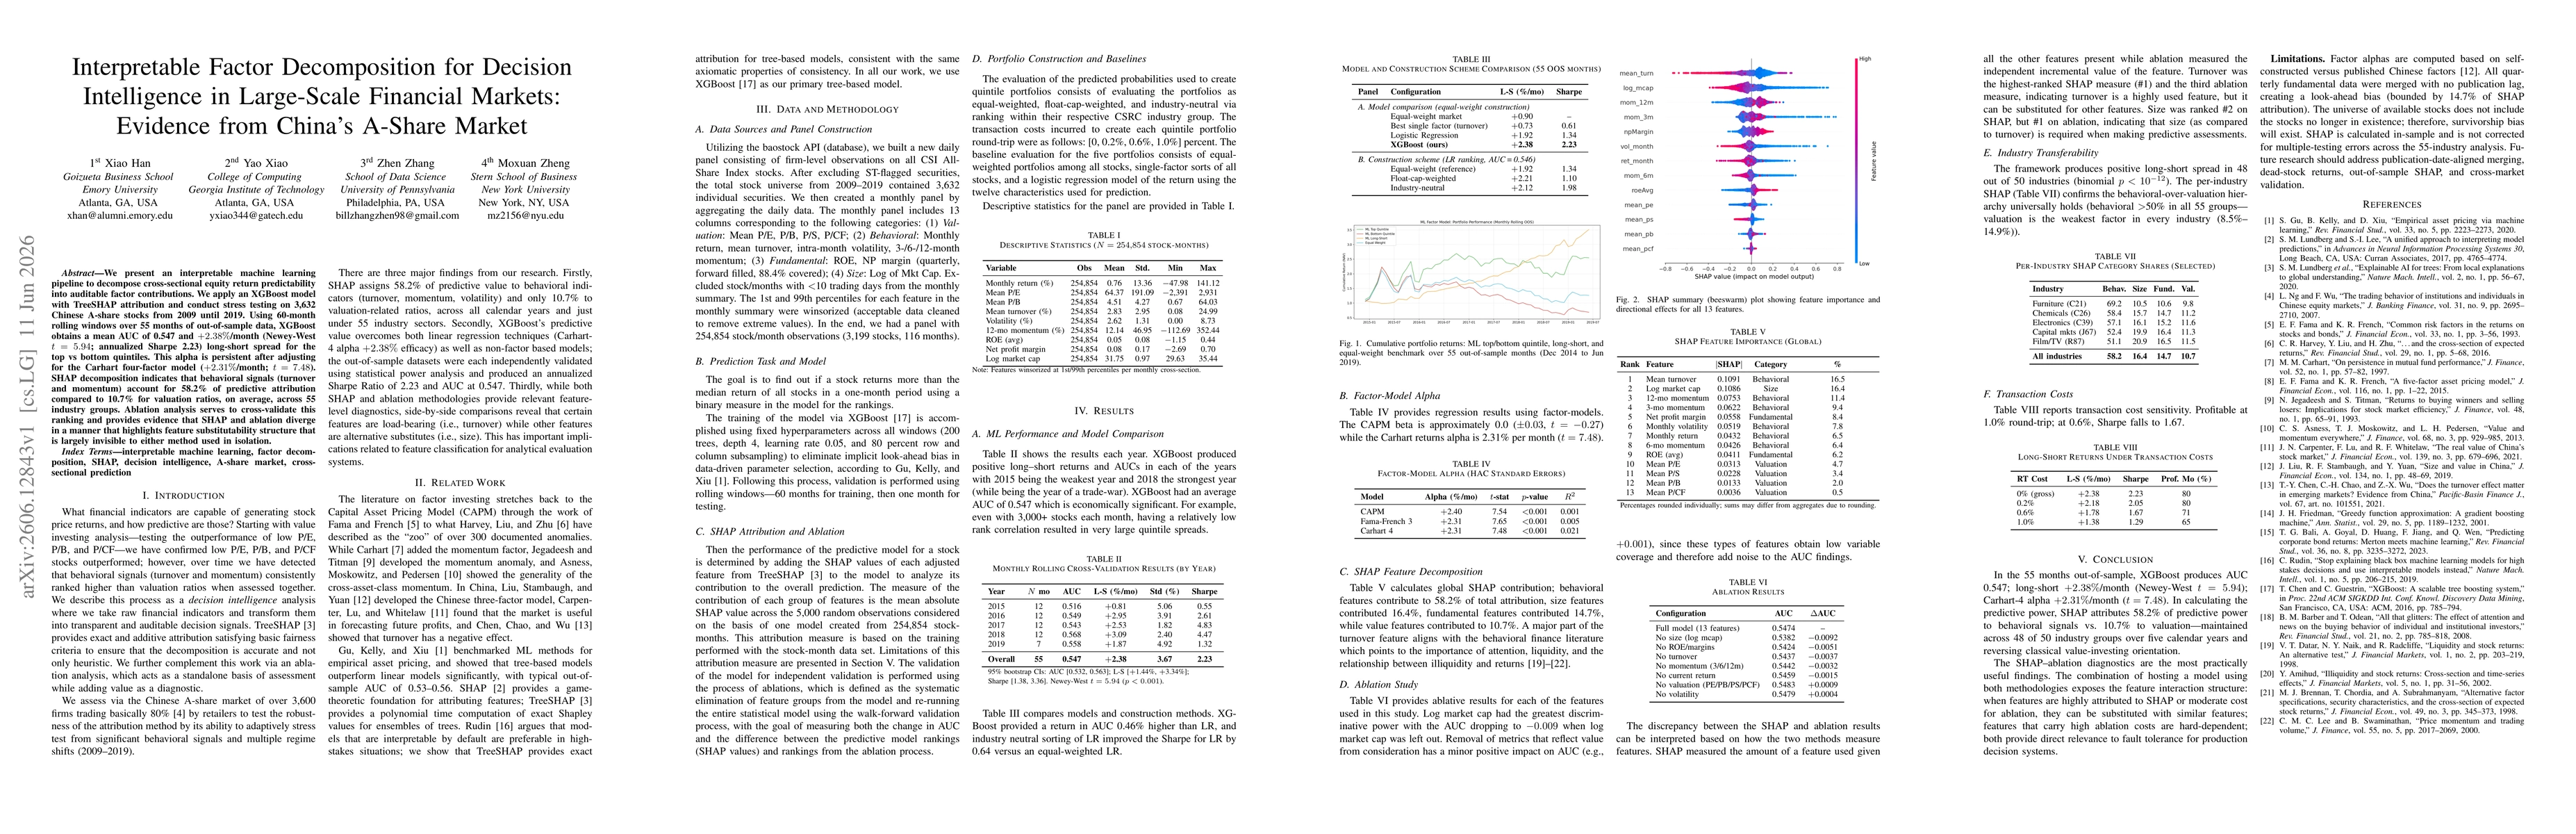
We present an interpretable machine learning pipeline to decompose Cross-Sectional Equity Return Predictability into auditable factor contribution. We apply an XGBoost model with TreeSHAP attribution and conduct stress testing on 3632 Chinese A-share stocks from 2009 until 2019. Using 60-month, rolling windows over 55 months of out-of-sample data, XGBoost obtains a mean AUC of 0.547 and +2.38%/month (Newey-West t = 5.94; Annualized Sharpe 2.23) long-short spread for the top vs bottom quintiles. This alpha is persistent after adjusting for the Carhart four-factor model (+2.31%/month; t = 7.48). SHAP Decomposition indicates that behavioral signals (turnover and momentum) account for 58.2% of predictive attribution compared to 10.7% for valuation ratios, on average, across 55 industry groups. Ablation analysis serves to cross-validate this ranking and provides evidence that SHAP and ablation diverge in a manner that highlights feature substitutability structure that is largely invisible to either method used in isolation.
Key Findings, in focus

Seven facets of this paper, analysed and brought into focus by AI.

AI-generated · verify against source Generated Jun 15, 2026
In focus · one-line synthesis

Demonstrates that interpretable, tree-based models with SHAP attributions can audibly decompose cross-sectional equity return predictability into dominant behavioral factors, providing diagnostic tools for risk-aware decision systems and offering cross-market and cross-industry robustness evidence.

01
MethodologyHow they did it

An interpretable machine learning pipeline that decomposes cross-sectional equity return predictability into auditable factor contributions, using an XGBoost model with TreeSHAP attribution, rolling 60-month training and 1-month test windows on 3,632 Chinese A-share stocks (2009–2019), with stress testing and ablation analyses to validate feature contributions and interactions.

02
ResultsWhat they found
  • XGBoost achieved an average AUC of 0.547 and a long-short return of +2.38% per month (Newey-West t = 5.94; annualized Sharpe 2.23) across 55 out-of-sample months.
  • Alpha remained persistent after Carhart four-factor adjustment (+2.31%/month; t = 7.48).
  • SHAP decomposition attributed 58.2% of predictive power to behavioral signals (turnover and momentum) versus 10.7% to valuation ratios, across ~55 industry groups.
  • Ablation analyses corroborated the SHAP ranking and highlighted feature substitutability structures; turnover is highly influential but substitutable by other features, while size is needed for predictive assessment.
  • Framework shows positive long-short returns in 48 of 50 industries, with SHAP per-industry results confirming the behavioral-over-valuation hierarchy.
03
SignificanceWhy it matters

Demonstrates that interpretable, tree-based models with SHAP attributions can audibly decompose cross-sectional equity return predictability into dominant behavioral factors, providing diagnostic tools for risk-aware decision systems and offering cross-market and cross-industry robustness evidence.

04
Technical ContributionsWhat's new technically

Integration of TreeSHAP with an XGBoost-based cross-sectional predictor to produce auditable, additive attributions of predictive power across behavioral, size, fundamental, and valuation feature groups, plus ablation framework for diagnostic cross-validation.

05
NoveltyWhat sets it apart

First to quantify and compare SHAP-based behavioral vs. valuation contributions in a large-scale Chinese A-share cross-sectional predictability setting, demonstrating substantial dominance of behavioral signals and exploring feature substitutability through SHAP and ablation in tandem.

06
LimitationsWhat to be cautious about
  • Factor alphas are computed on self-constructed vs. published Chinese factors, introducing potential construct validity concerns.
  • Look-ahead bias is bounded but present due to data merging without publication lag; survivorship bias remains due to stock universe constraints.
  • SHAP attribution is in-sample and not corrected for multiple testing across 55 industries; generalizability to out-of-sample or cross-market contexts may be limited.
07
Future WorkWhere it goes next
  • Address publication-date aligned merging, dead-stock returns, and out-of-sample SHAP to enhance out-of-sample validity.
  • Investigate cross-market validation and alternative factor constructions to test robustness of behavioral vs. valuation attributions.
  • Incorporate multiple-testing corrections and out-of-sample SHAP calibration to improve inference for production deployment.

Paper Details

Paper ID: 2606.12843
Categories:
cs.LG cs.CE

How to Cite This Paper

Reference manager: RIS EndNote


Discussion 0

This website uses cookies to ensure you get the best experience. Learn more