Interpretable Hierarchical Attention Network for Medical Condition Identification
Publication
Metrics
AI Quick Summary
This paper introduces an Interpretable Hierarchical Attention Network (IHAN) to predict stage 3 chronic kidney disease using hierarchical attention mechanisms to enhance interpretability and accuracy. The model utilizes three levels of attention to analyze different layers of medical data, offering insights into individual medical event contributions.
Paper Preview
Abstract
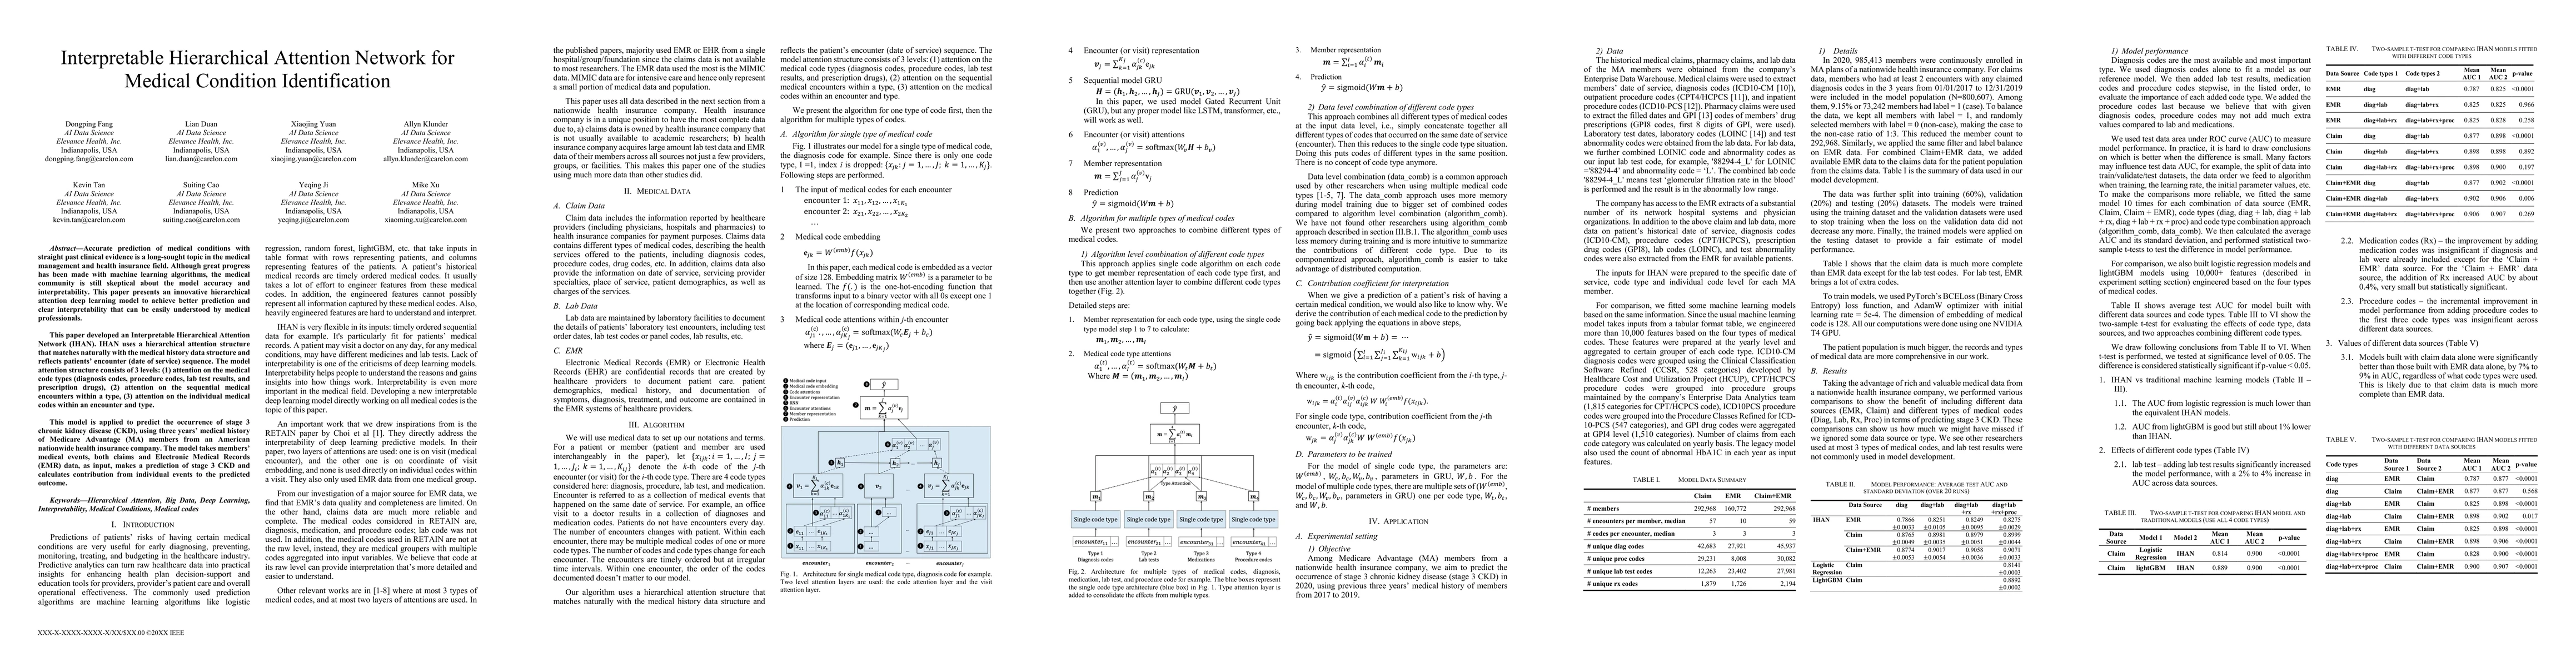
Accurate prediction of medical conditions with straight past clinical evidence is a long-sought topic in the medical management and health insurance field. Although great progress has been made with machine learning algorithms, the medical community is still skeptical about the model accuracy and interpretability. This paper presents an innovative hierarchical attention deep learning model to achieve better prediction and clear interpretability that can be easily understood by medical professionals. This paper developed an Interpretable Hierarchical Attention Network (IHAN). IHAN uses a hierarchical attention structure that matches naturally with the medical history data structure and reflects patients encounter (date of service) sequence. The model attention structure consists of 3 levels: (1) attention on the medical code types (diagnosis codes, procedure codes, lab test results, and prescription drugs), (2) attention on the sequential medical encounters within a type, (3) attention on the individual medical codes within an encounter and type. This model is applied to predict the occurrence of stage 3 chronic kidney disease (CKD), using three years medical history of Medicare Advantage (MA) members from an American nationwide health insurance company. The model takes members medical events, both claims and Electronic Medical Records (EMR) data, as input, makes a prediction of stage 3 CKD and calculates contribution from individual events to the predicted outcome.
AI Key Findings
Get AI-generated insights about this paper's methodology, results, significance, and more — seven facets brought into focus.
Authors
PDF Preview
Related Papers
No references found for this paper.
Discussion 0