Interpreting self-organizing maps through space--time data models
Publication
Metrics
AI Quick Summary
This research paper explores the use of self-organizing maps to analyze daily data collection, revealing its potential as a representation technique for understanding high-dimensional space through time series analysis.
Paper Preview
Abstract
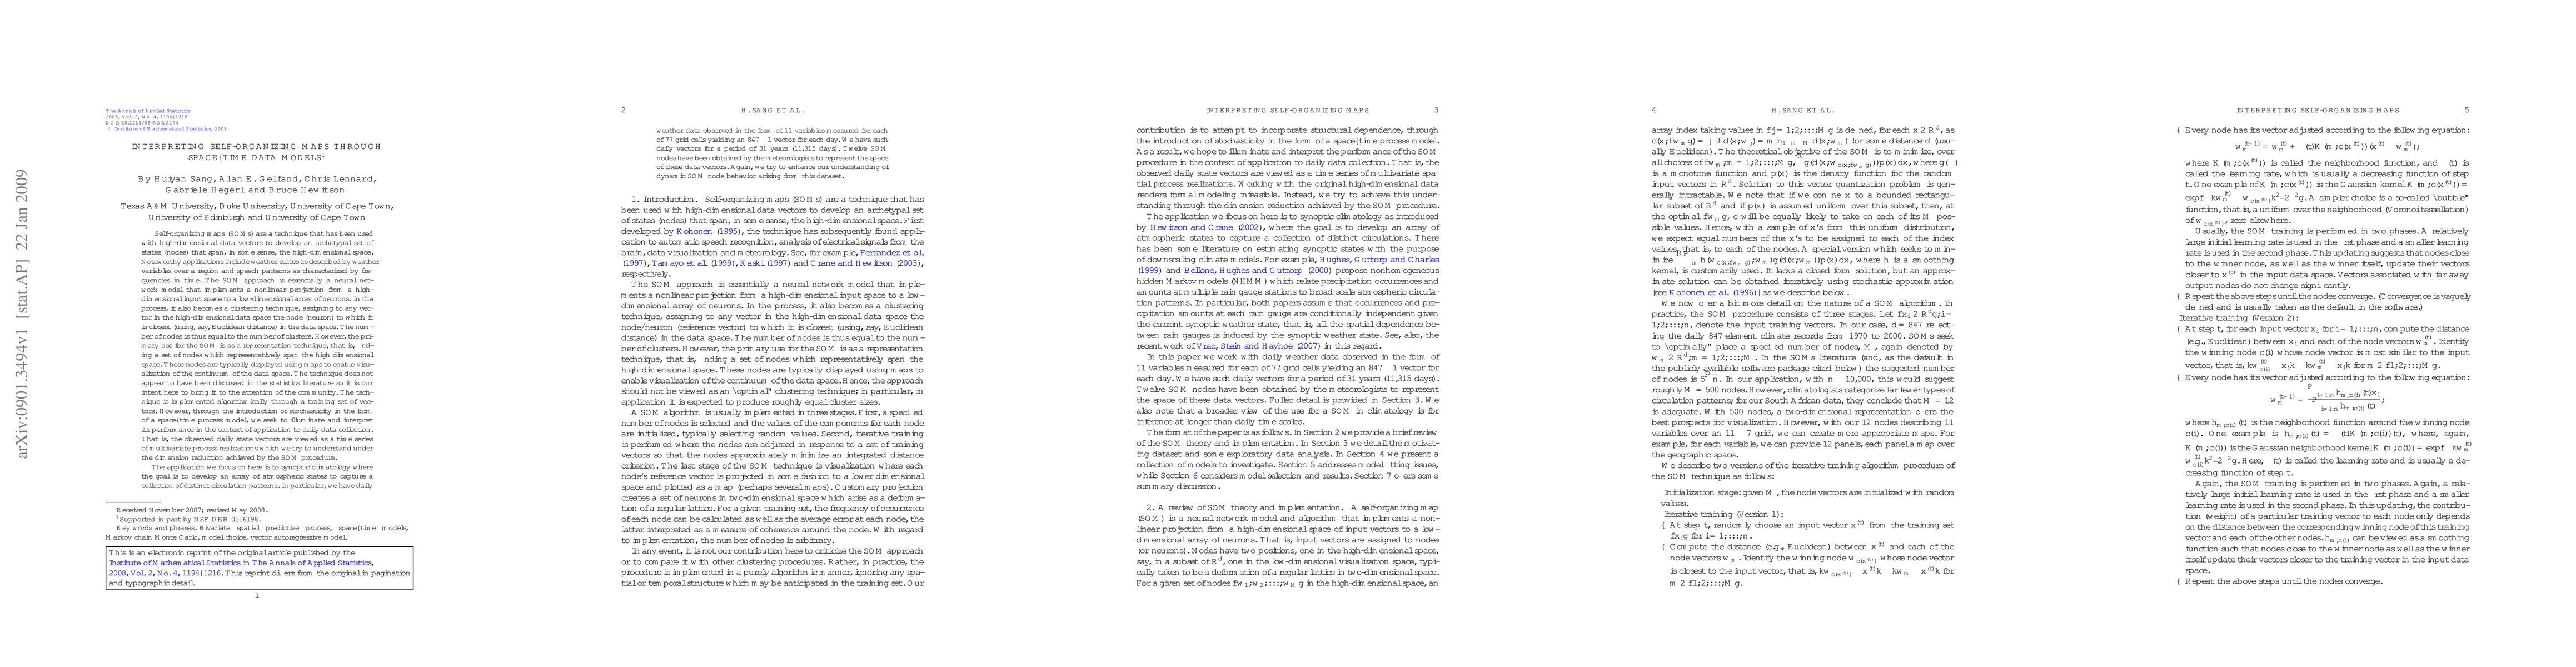
Self-organizing maps (SOMs) are a technique that has been used with high-dimensional data vectors to develop an archetypal set of states (nodes) that span, in some sense, the high-dimensional space. Noteworthy applications include weather states as described by weather variables over a region and speech patterns as characterized by frequencies in time. The SOM approach is essentially a neural network model that implements a nonlinear projection from a high-dimensional input space to a low-dimensional array of neurons. In the process, it also becomes a clustering technique, assigning to any vector in the high-dimensional data space the node (neuron) to which it is closest (using, say, Euclidean distance) in the data space. The number of nodes is thus equal to the number of clusters. However, the primary use for the SOM is as a representation technique, that is, finding a set of nodes which representatively span the high-dimensional space. These nodes are typically displayed using maps to enable visualization of the continuum of the data space. The technique does not appear to have been discussed in the statistics literature so it is our intent here to bring it to the attention of the community. The technique is implemented algorithmically through a training set of vectors. However, through the introduction of stochasticity in the form of a space--time process model, we seek to illuminate and interpret its performance in the context of application to daily data collection. That is, the observed daily state vectors are viewed as a time series of multivariate process realizations which we try to understand under the dimension reduction achieved by the SOM procedure.
AI Key Findings
Get AI-generated insights about this paper's methodology, results, significance, and more — seven facets brought into focus.
Impact
Paper Details
PDF Preview
Key Terms
Citation Network
Current paper (gray), citations (green), references (blue)
Display is limited for performance on very large graphs.
Discussion 0