Publication
Metrics
AI Quick Summary
This paper explores the correlation between local extinction and star formation surface density in nearby star-forming galaxies from the MaNGA survey. It finds a linear scaling between extinction of Hα emission and star formation density, with secondary dependencies influenced by metallicity and Hα emission characteristics.
Paper Preview
Abstract
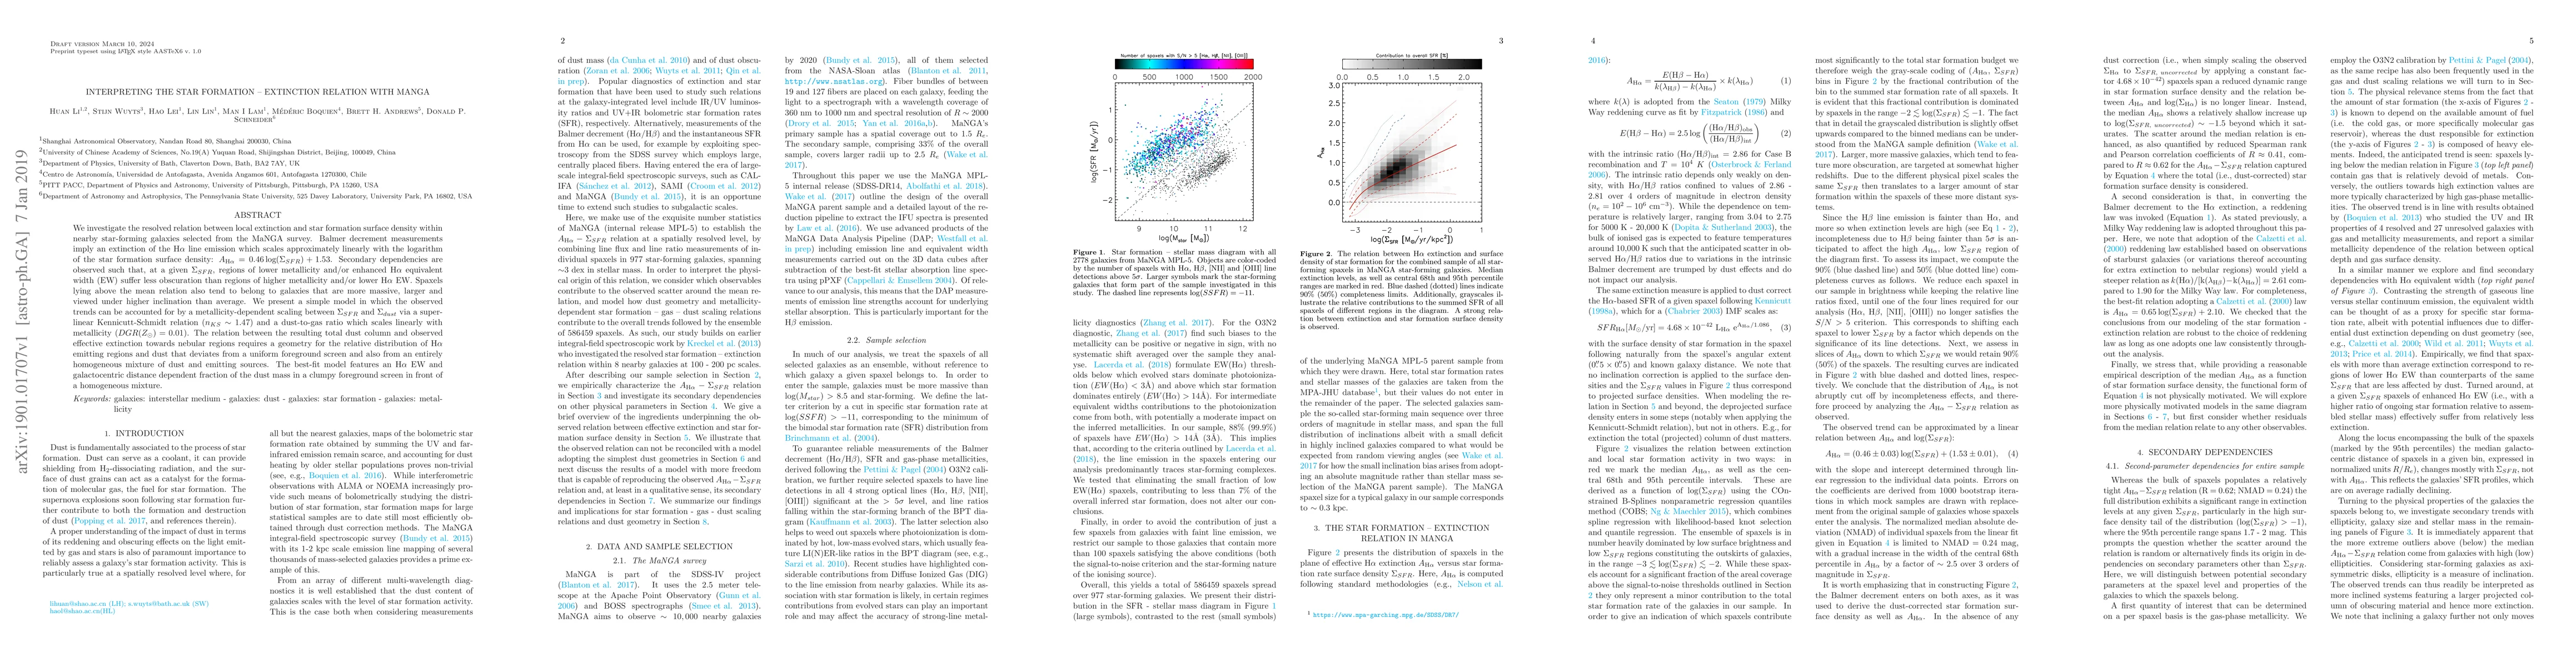
We investigate the resolved relation between local extinction and star formation surface density within nearby star-forming galaxies selected from the MaNGA survey. Balmer decrement measurements imply an extinction of the H{\alpha} line emission which scales approximately linearly with the logarithm of the star formation surface density: $ A_{H{\alpha}} = 0.46 \log(\Sigma_{SFR}) + 1.53$. Secondary dependencies are observed such that, at a given $\Sigma_{SFR}$, regions of lower metallicity and/or enhanced H{\alpha} equivalent width (EW) suffer less obscuration than regions of higher metallicity and/or lower H{\alpha} EW. Spaxels lying above the mean relation also tend to belong to galaxies that are more massive, larger and viewed under higher inclination than average. We present a simple model in which the observed trends can be accounted for by a metallicity-dependent scaling between $\Sigma_{SFR}$ and $\Sigma_{dust}$ via a super-linear Kennicutt-Schmidt relation ($n_{KS} \sim 1.47$) and a dust-to-gas ratio which scales linearly with metallicity (DGR($Z_{\odot}$) = 0.01). The relation between the resulting total dust column and observed effective extinction towards nebular regions requires a geometry for the relative distribution of H{\alpha} emitting regions and dust that deviates from a uniform foreground screen and also from an entirely homogeneous mixture of dust and emitting sources. The best-fit model features an H{\alpha} EW and galactocentric distance dependent fraction of the dust mass in a clumpy foreground screen in front of a homogeneous mixture.
AI Key Findings
Get AI-generated insights about this paper's methodology, results, significance, and more — seven facets brought into focus.
Impact
Paper Details
PDF Preview
Key Terms
Citation Network
Current paper (gray), citations (green), references (blue)
Display is limited for performance on very large graphs.
Discussion 0