Interval Estimation of Relative Risks for Combined Unilateral and Bilateral Correlated Data
Publication
Metrics
AI Quick Summary
This paper develops three confidence intervals for estimating relative risks in clinical trials using combined unilateral and bilateral correlated data. Simulation studies and comparisons suggest the score confidence interval is most effective, controlling coverage probabilities well and offering reasonable interval width.
Paper Preview
Abstract
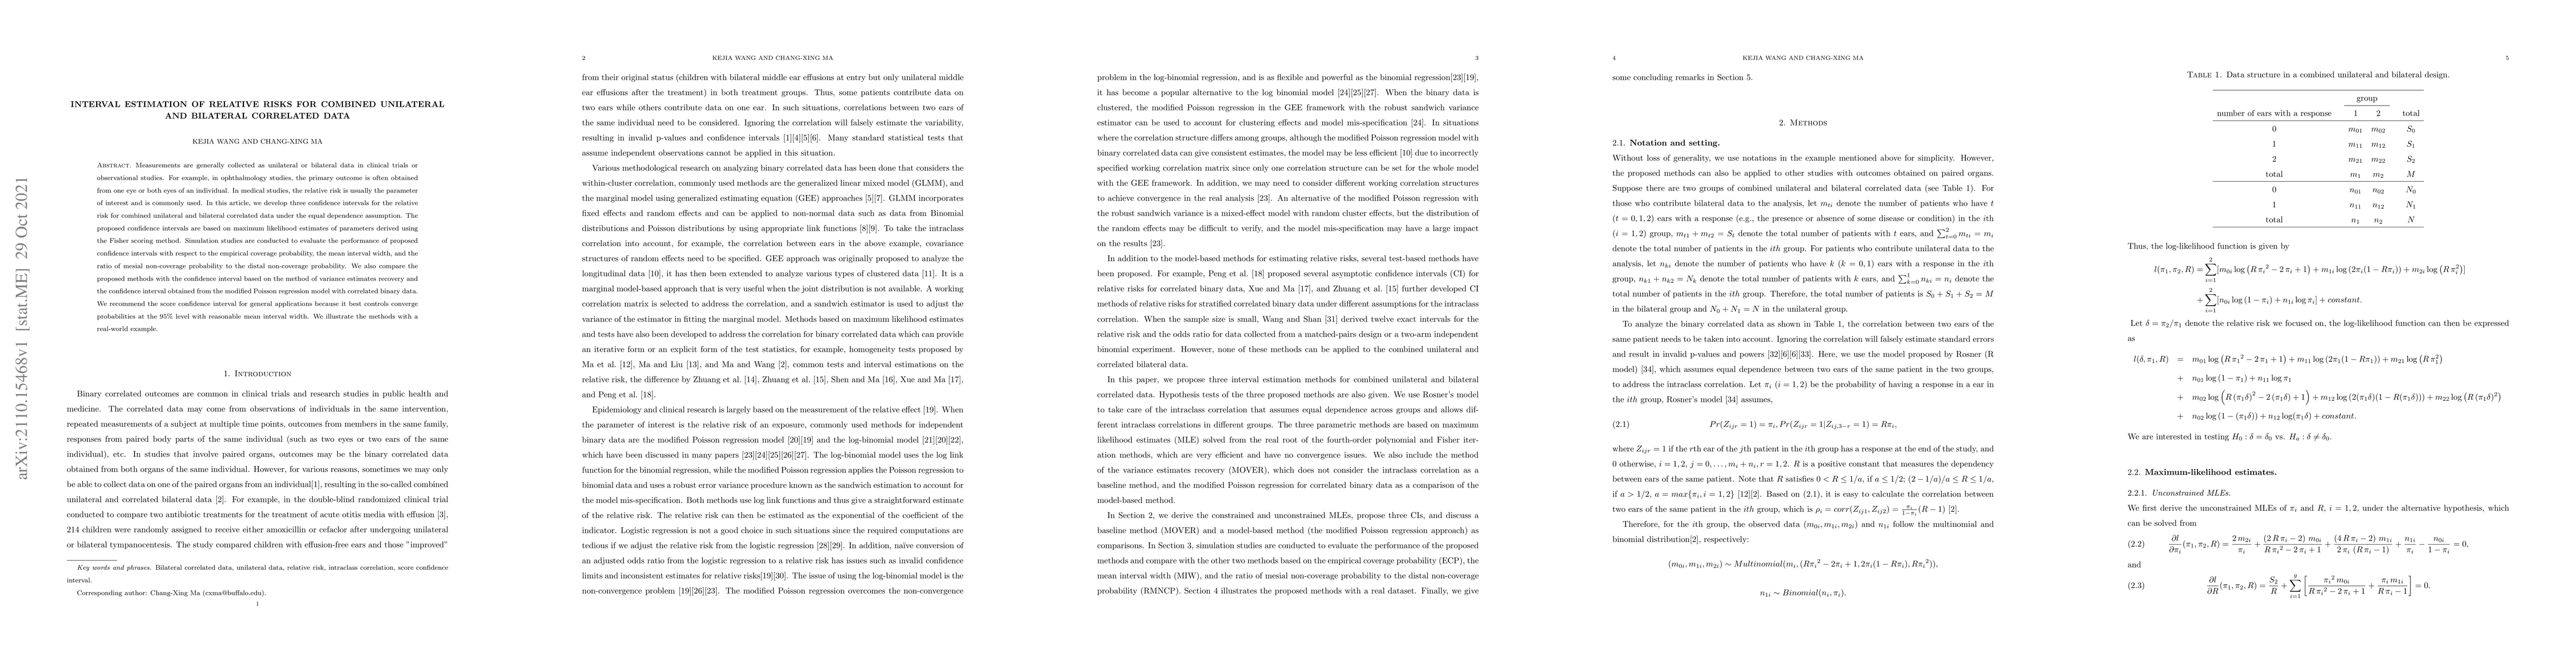
Measurements are generally collected as unilateral or bilateral data in clinical trials or observational studies. For example, in ophthalmology studies, the primary outcome is often obtained from one eye or both eyes of an individual. In medical studies, the relative risk is usually the parameter of interest and is commonly used. In this article, we develop three confidence intervals for the relative risk for combined unilateral and bilateral correlated data under the equal dependence assumption. The proposed confidence intervals are based on maximum likelihood estimates of parameters derived using the Fisher scoring method. Simulation studies are conducted to evaluate the performance of proposed confidence intervals with respect to the empirical coverage probability, the mean interval width, and the ratio of mesial non-coverage probability to the distal non-coverage probability. We also compare the proposed methods with the confidence interval based on the method of variance estimates recovery and the confidence interval obtained from the modified Poisson regression model with correlated binary data. We recommend the score confidence interval for general applications because it best controls converge probabilities at the 95% level with reasonable mean interval width. We illustrate the methods with a real-world example.
AI Key Findings
Get AI-generated insights about this paper's methodology, results, significance, and more — seven facets brought into focus.
Impact
Paper Details
Authors
PDF Preview
Key Terms
Citation Network
Current paper (gray), citations (green), references (blue)
Display is limited for performance on very large graphs.
Discussion 0