Publication
Metrics
AI Quick Summary
This paper introduces pipes_vis, an interactive GUI tool for visualizing galaxy spectra, enabling real-time manipulation of galaxy properties to understand their non-linear effects on spectral energy distributions. It aims to enhance teaching and speed up fitting stages in galaxy research.
Paper Preview
Abstract
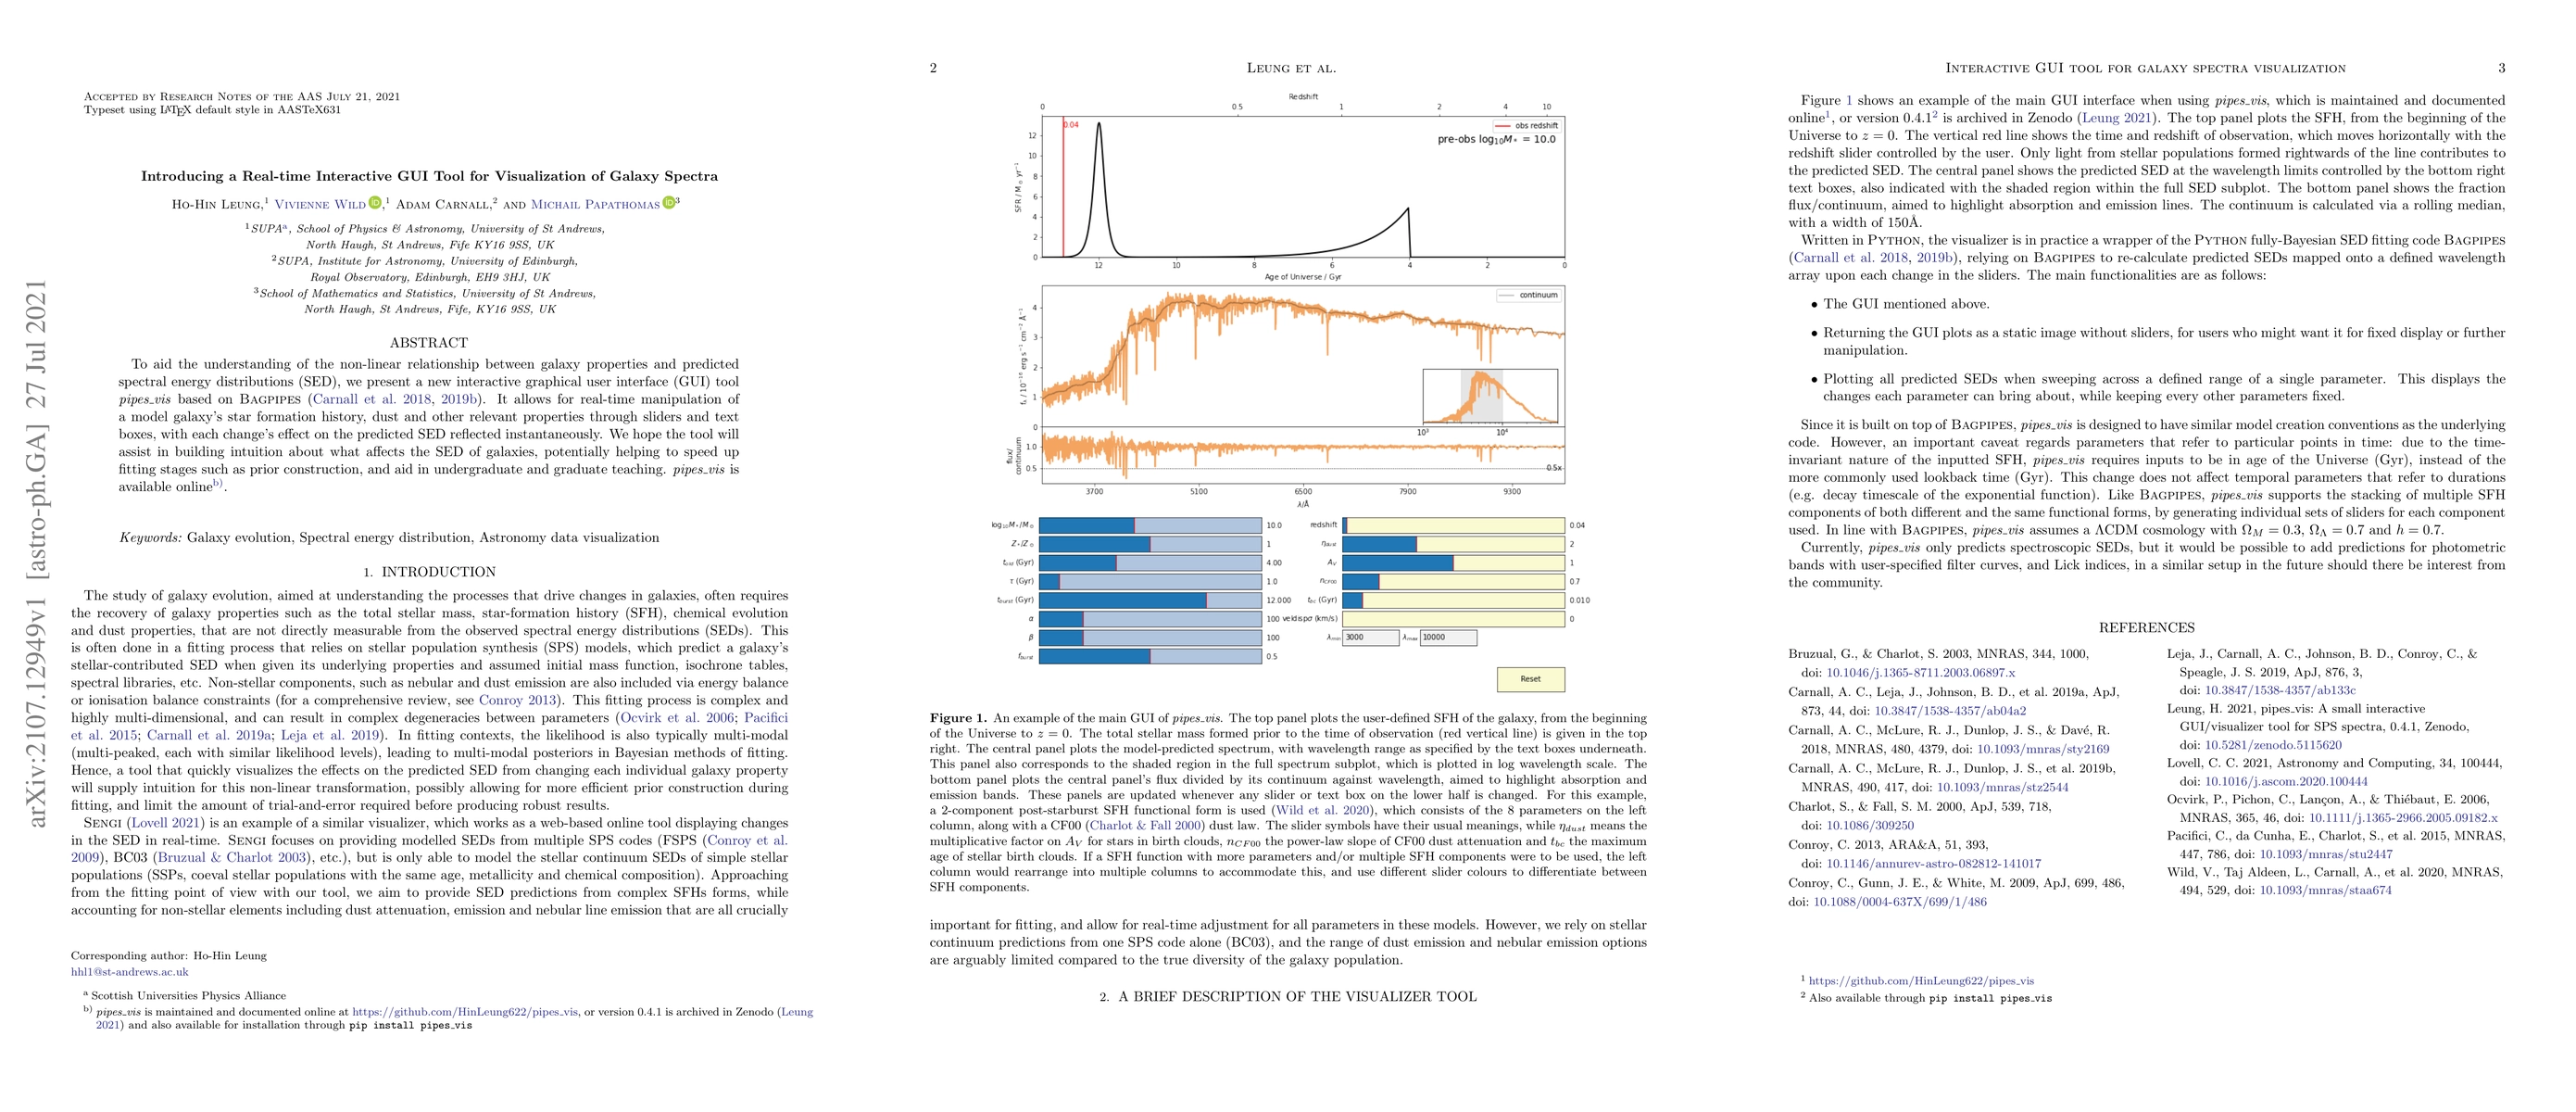
To aid the understanding of the non-linear relationship between galaxy properties and predicted spectral energy distributions (SED), we present a new interactive graphical user interface (GUI) tool pipes_vis based on Bagpipes \citep{arXiv:1712.04452,arXiv:1903.11082}. It allows for real-time manipulation of a model galaxy's star formation history, dust and other relevant properties through sliders and text boxes, with each change's effect on the predicted SED reflected instantaneously. We hope the tool will assist in building intuition about what affects the SED of galaxies, potentially helping to speed up fitting stages such as prior construction, and aid in undergraduate and graduate teaching. pipes_vis is available online (pipes_vis is maintained and documented online at https://github.com/HinLeung622/pipes_vis, or version 0.4.1 is archived in Zenodo and also available for installation through pip install pipes_vis).
AI Key Findings
Get AI-generated insights about this paper's methodology, results, significance, and more — seven facets brought into focus.
Impact
Paper Details
Authors
PDF Preview
Key Terms
Citation Network
Current paper (gray), citations (green), references (blue)
Display is limited for performance on very large graphs.
Discussion 0