Publication
Metrics
AI Quick Summary
This paper details a method for generating longitudinal brightness maps of tidally locked exoplanets from their phase function light curves, introducing two simplified models for the transformation. It discusses numerical techniques for map extraction and uncertainty estimation, demonstrating the sinusoidal model's better fit to brightness maps, while noting the slice model's utility for partial light curves, with a maximum of ~5 fittable parameters due to light curve insensitivity.
Paper Preview
Abstract
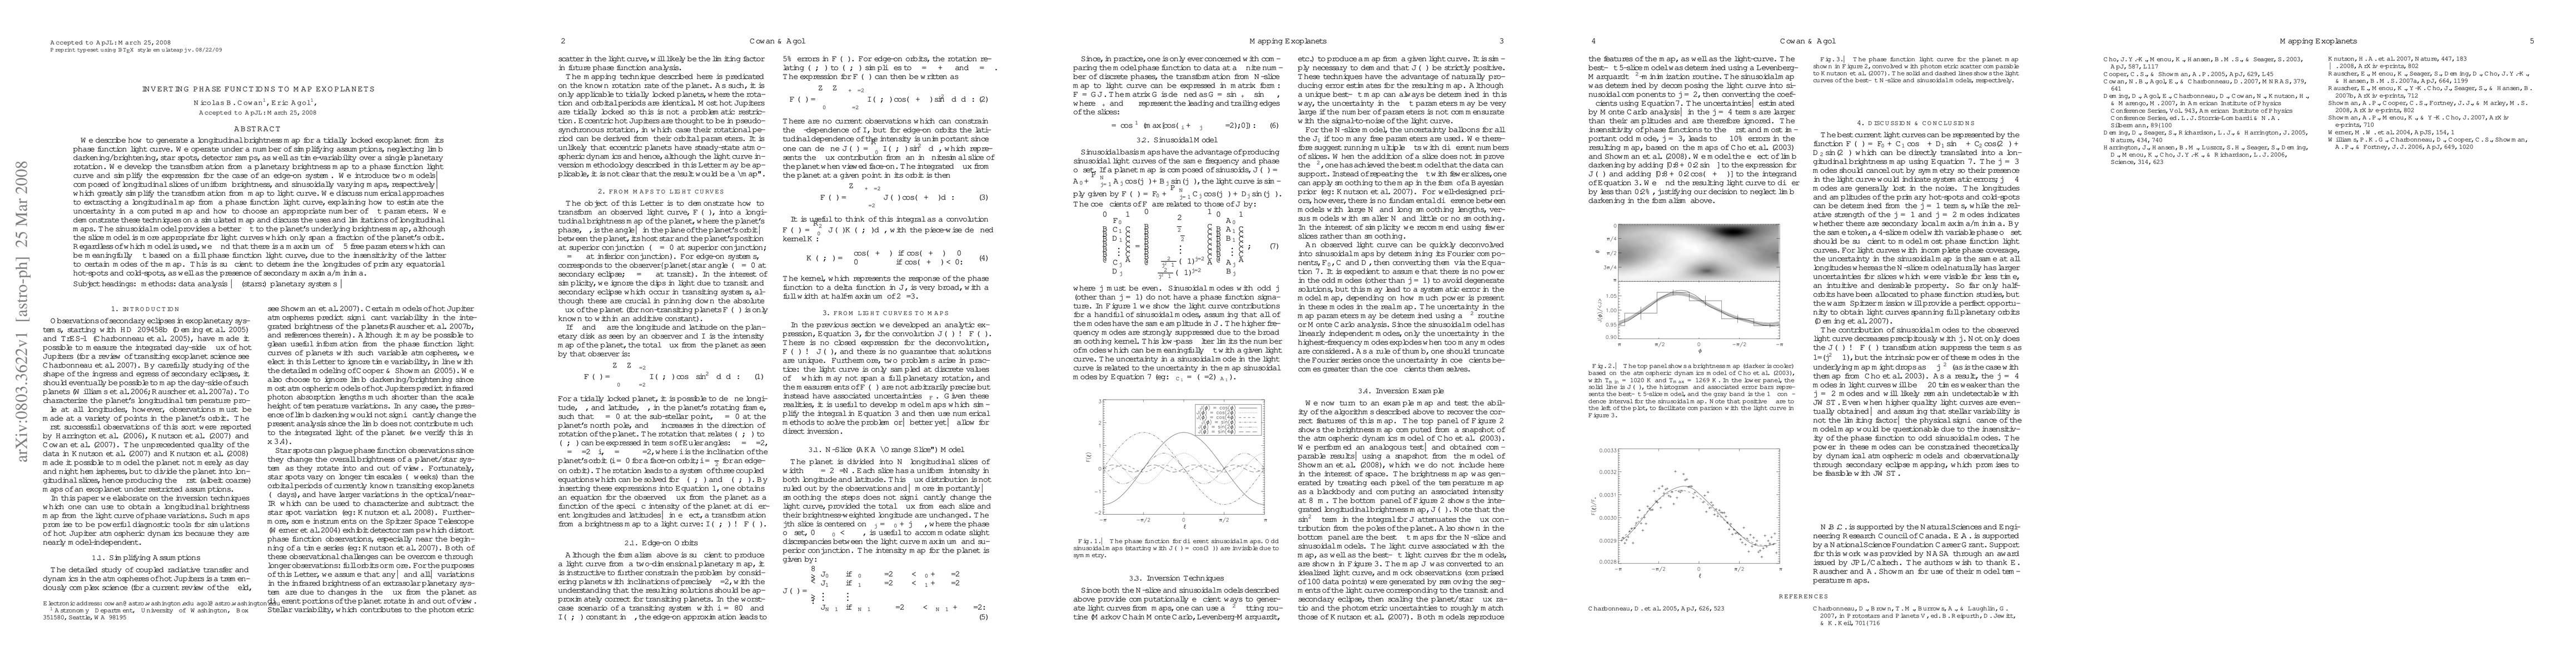
We describe how to generate a longitudinal brightness map for a tidally locked exoplanet from its phase function light curve. We operate under a number of simplifying assumptions, neglecting limb darkening/brightening, star spots, detector ramps, as well as time-variability over a single planetary rotation. We develop the transformation from a planetary brightness map to a phase function light curve and simplify the expression for the case of an edge-on system. We introduce two models--composed of longitudinal slices of uniform brightness, and sinusoidally varying maps, respectively--which greatly simplify the transformation from map to light curve. We discuss numerical approaches to extracting a longitudinal map from a phase function light curve, explaining how to estimate the uncertainty in a computed map and how to choose an appropriate number of fit parameters. We demonstrate these techniques on a simulated map and discuss the uses and limitations of longitudinal maps. The sinusoidal model provides a better fit to the planet's underlying brightness map, although the slice model is more appropriate for light curves which only span a fraction of the planet's orbit. Regardless of which model is used, we find that there is a maximum of ~5 free parameters which can be meaningfully fit based on a full phase function light curve, due to the insensitivity of the latter to certain modes of the map.
AI Key Findings
Get AI-generated insights about this paper's methodology, results, significance, and more — seven facets brought into focus.
Impact
Paper Details
PDF Preview
Key Terms
Citation Network
Current paper (gray), citations (green), references (blue)
Display is limited for performance on very large graphs.
Discussion 0