Investigating the Impact of Metric Aggregation Techniques on Defect Prediction
Publication
Metrics
AI Quick Summary
This paper investigates the impact of various metric aggregation techniques on defect prediction, finding that summation aggregation yields better defect prediction models compared to other techniques like central tendency, dispersion, shape, and income inequality measures. Complex aggregations do not significantly outperform simpler ones.
Paper Preview
Abstract
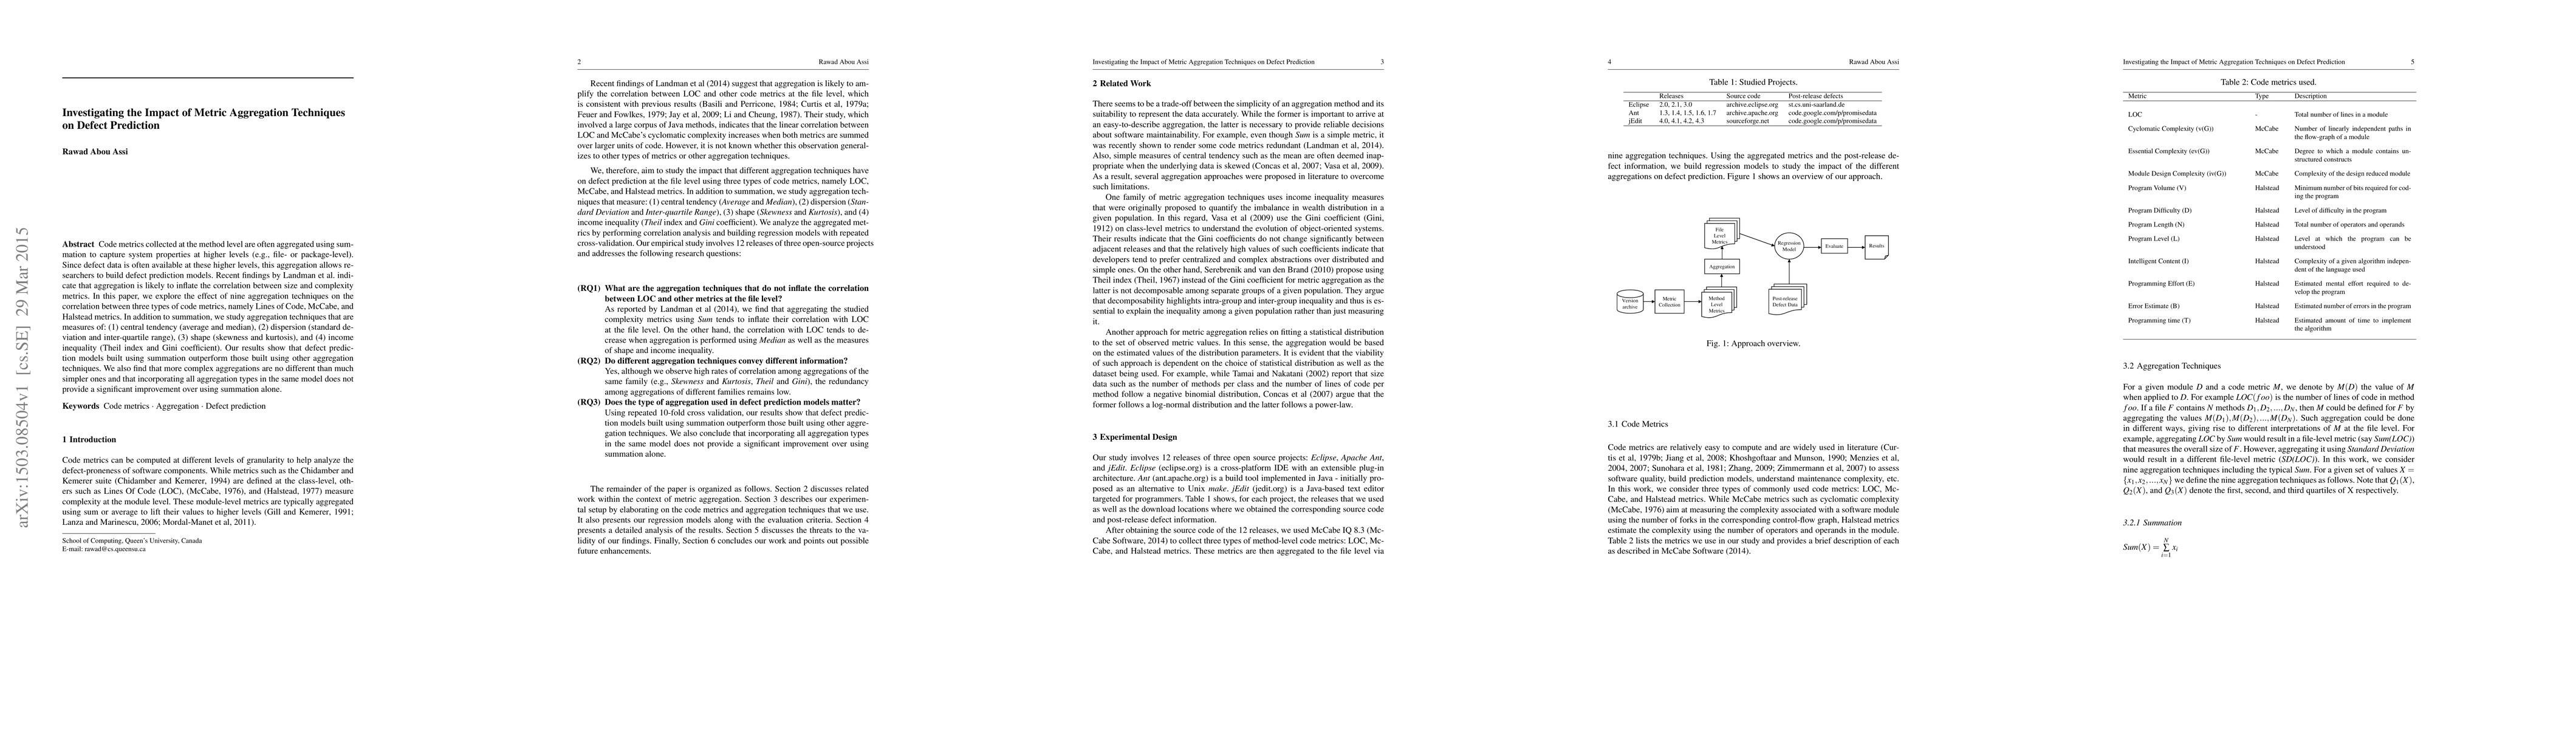
Code metrics collected at the method level are often aggregated using summation to capture system properties at higher levels (e.g., file- or package-level). Since defect data is often available at these higher levels, this aggregation allows researchers to build defect prediction models. Recent findings by Landman et al. indicate that aggregation is likely to inflate the correlation between size and complexity metrics. In this paper, we explore the effect of nine aggregation techniques on the correlation between three types of code metrics, namely Lines of Code, McCabe, and Halstead metrics. In addition to summation, we study aggregation techniques that are measures of: (1) central tendency (average and median), (2) dispersion (standard deviation and inter-quartile range), (3) shape (skewness and kurtosis), and (4) income inequality (Theil index and Gini coefficient). Our results show that defect prediction models built using summation outperform those built using other aggregation techniques. We also find that more complex aggregations are no different than much simpler ones and that incorporating all aggregation types in the same model does not provide a significant improvement over using summation alone.
AI Key Findings
Get AI-generated insights about this paper's methodology, results, significance, and more — seven facets brought into focus.
Impact
Paper Details
PDF Preview
Key Terms
Citation Network
Current paper (gray), citations (green), references (blue)
Display is limited for performance on very large graphs.
Discussion 0