01
MethodologyHow they did it
A usability study was conducted to evaluate the user experience of the MSstatsQC website
A usability study was conducted to evaluate the user experience of the MSstatsQC website More in Methodology →
The website's navigation was found to be intuitive and easy to use — However, some users reported difficulty finding specific information More in Key Results →
This study highlights the importance of user experience in scientific research websites More in Significance →
The sample size was relatively small and may not be representative of all users — Some users reported difficulty with the website's layout and design More in Limitations →
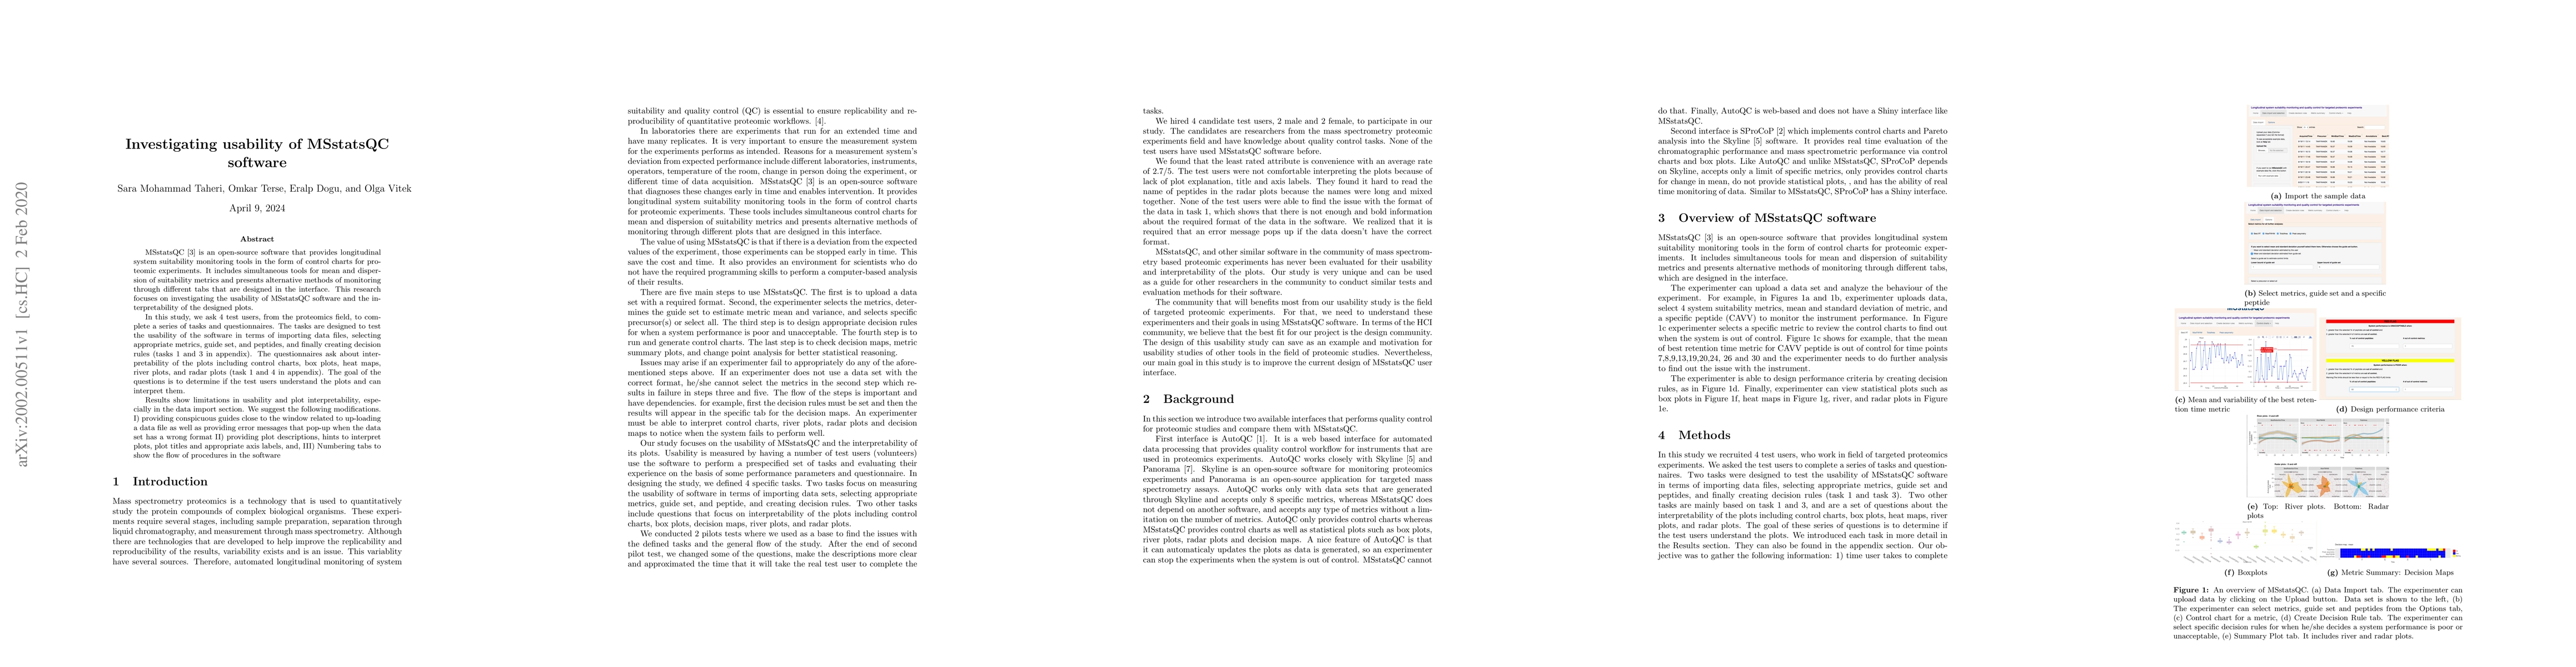
MSstatsQC [3] is an open-source software that provides longitudinal system suitability monitoring tools in the form of control charts for proteomic experiments. It includes simultaneous tools for the mean and dispersion of suitability metrics and presents alternative methods of monitoring through different tabs that are designed in the interface. This research focuses on investigating the usability of MSstatsQC software and the interpretability of the designed plots. In this study, we ask 4 test users, from the proteomics field, to complete a series of tasks and questionnaires. The tasks are designed to test the usability of the software in terms of importing data files, selecting appropriate metrics, guide set, and peptides, and finally creating decision rules (tasks 1 and 3 in appendix). The questionnaires ask about interpretability of the plots including control charts, box plots, heat maps, river plots, and radar plots (tasks 1 and 4 in appendix). The goal of the questions is to determine if the test users understand the plots and can interpret them. Results show limitations in usability and plot interpretability, especially in the data import section. We suggest the following modifications. I) providing conspicuous guides close to the window related to up-loading a datafile as well as providing error messages that pop-up when the data set has a wrong format II) providing plot descriptions, hints to interpret plots, plot titles and appropriate axis labels, and, III) Numbering tabs to show the flow of procedures in the software.
Seven facets of this paper, analysed and brought into focus by AI.
This study highlights the importance of user experience in scientific research websites
A usability study was conducted to evaluate the user experience of the MSstatsQC website
This study highlights the importance of user experience in scientific research websites
The study contributes to the understanding of user experience in scientific research websites
This study is novel in its focus on usability and user experience in scientific research websites
Current paper (gray), citations (green), references (blue)
Display is limited for performance on very large graphs.
Discussion 0