InvVis: Large-Scale Data Embedding for Invertible Visualization
Publication
Metrics
AI Quick Summary
InvVis is a novel method for embedding large amounts of data into visualization images while maintaining perceptual indistinguishability. It utilizes an invertible neural network to achieve high-quality data concealment and restoration, demonstrating significant potential in various application scenarios.
Paper Preview
Abstract
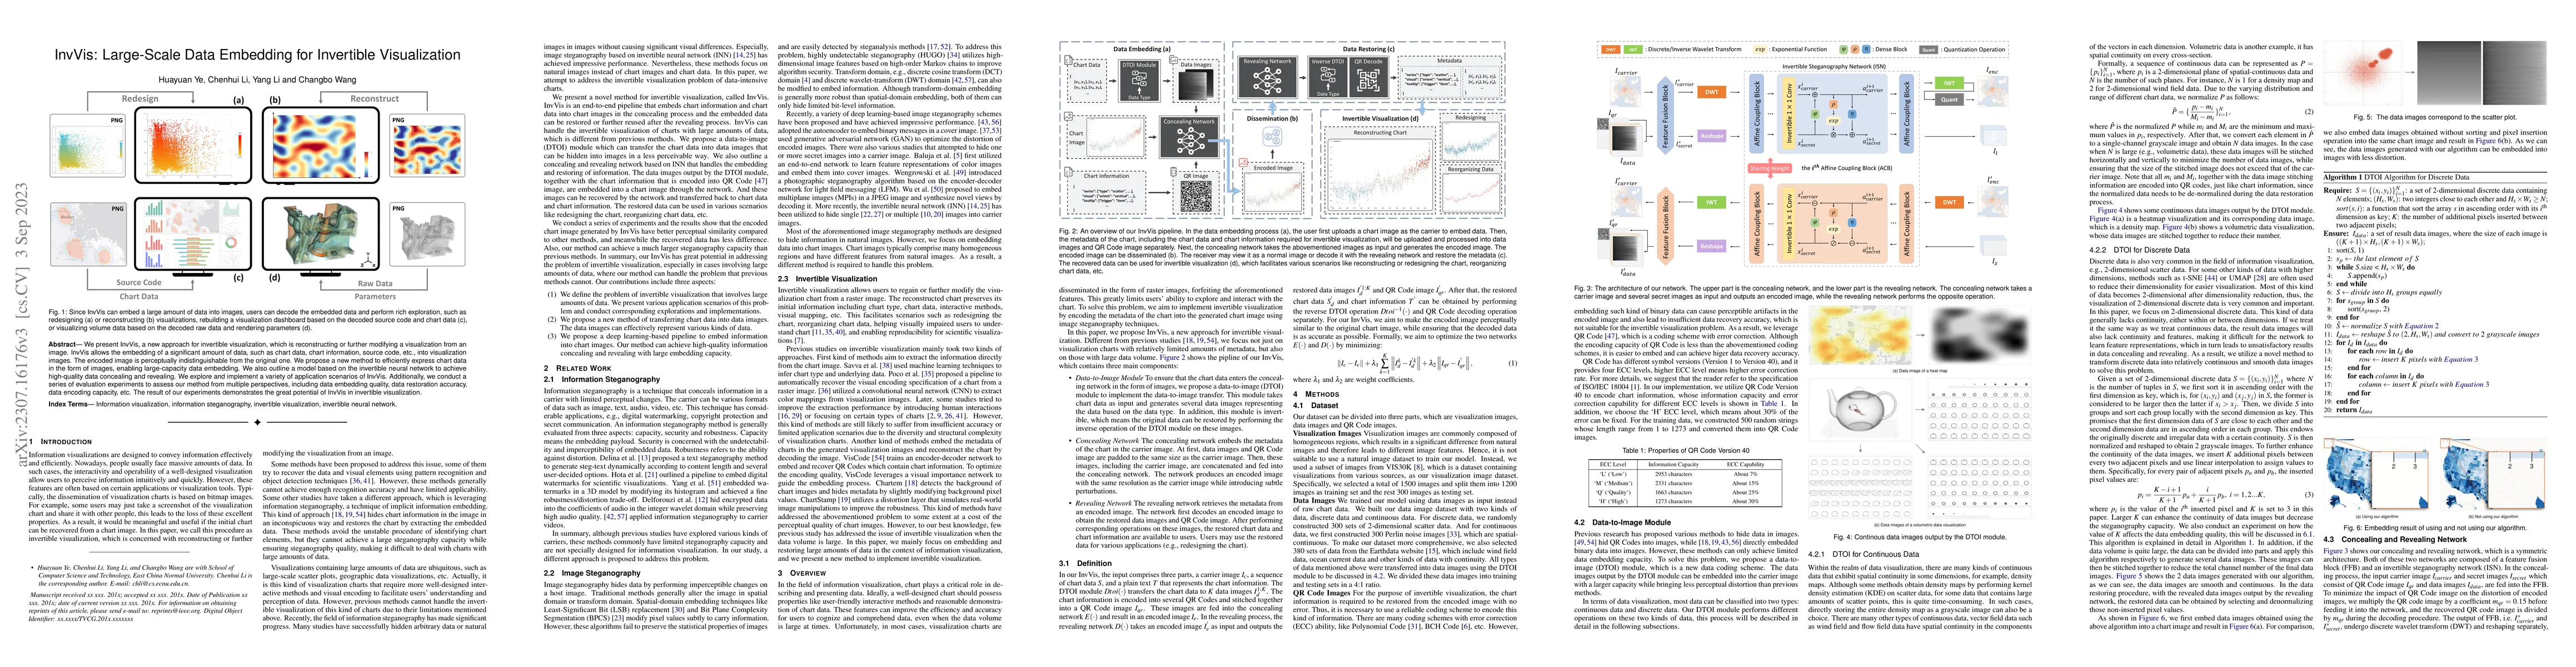
We present InvVis, a new approach for invertible visualization, which is reconstructing or further modifying a visualization from an image. InvVis allows the embedding of a significant amount of data, such as chart data, chart information, source code, etc., into visualization images. The encoded image is perceptually indistinguishable from the original one. We propose a new method to efficiently express chart data in the form of images, enabling large-capacity data embedding. We also outline a model based on the invertible neural network to achieve high-quality data concealing and revealing. We explore and implement a variety of application scenarios of InvVis. Additionally, we conduct a series of evaluation experiments to assess our method from multiple perspectives, including data embedding quality, data restoration accuracy, data encoding capacity, etc. The result of our experiments demonstrates the great potential of InvVis in invertible visualization.
AI Key Findings
Get AI-generated insights about this paper's methodology, results, significance, and more — seven facets brought into focus.
Impact
Paper Details
Authors
PDF Preview
Key Terms
Citation Network
Current paper (gray), citations (green), references (blue)
Display is limited for performance on very large graphs.
Discussion 0