IPF-HMGNN: A novel integrative prediction framework for metro passenger flow
Publication
Metrics
AI Quick Summary
The IPF-HMGNN framework utilizes a hierarchical message-passing graph neural network to improve metro passenger flow predictions, achieving significant reductions in prediction errors compared to traditional models, especially in hierarchical prediction scenarios that account for ticket types and aggregated flows.
Paper Preview
Abstract
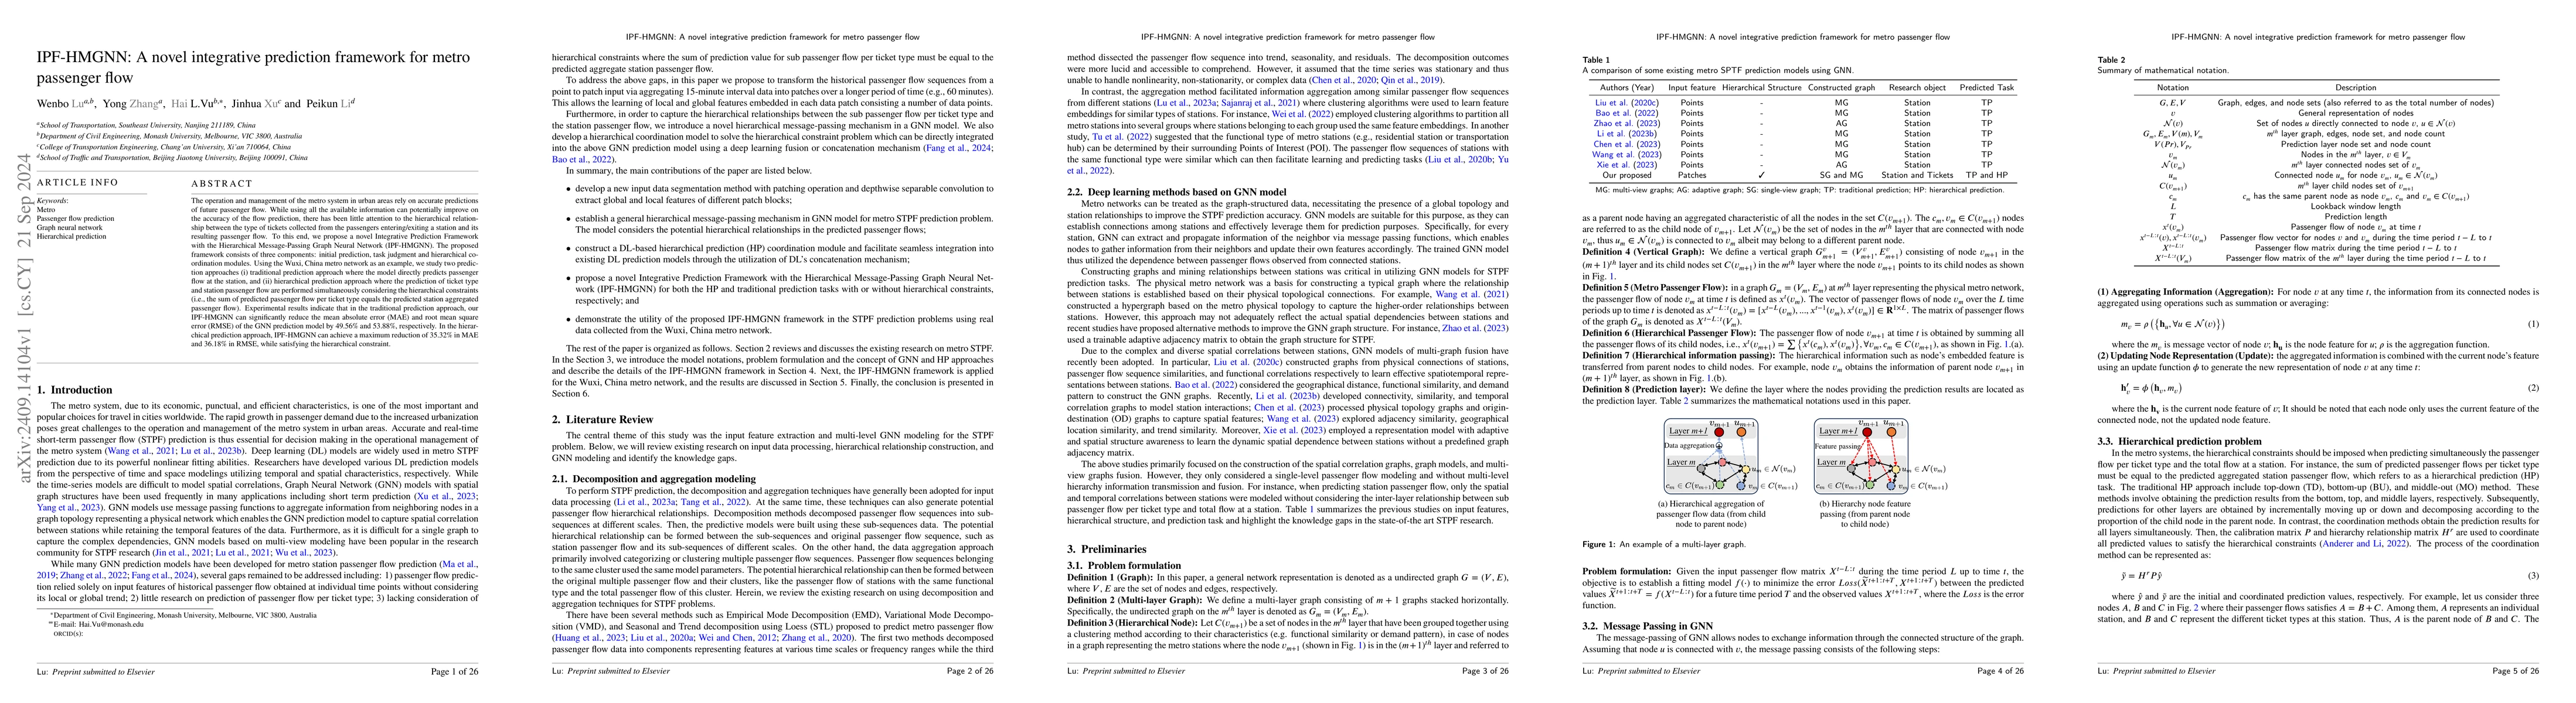
The operation and management of the metro system in urban areas rely on accurate predictions of future passenger flow. While using all the available information can potentially improve on the accuracy of the flow prediction, there has been little attention to the hierarchical relationship between the type of tickets collected from the passengers entering/exiting a station and its resulting passenger flow. To this end, we propose a novel Integrative Prediction Framework with the Hierarchical Message-Passing Graph Neural Network (IPF-HMGNN). The proposed framework consists of three components: initial prediction, task judgment and hierarchical coordination modules. Using the Wuxi, China metro network as an example, we study two prediction approaches (i) traditional prediction approach where the model directly predicts passenger flow at the station, and (ii) hierarchical prediction approach where the prediction of ticket type and station passenger flow are performed simultaneously considering the hierarchical constraints (i.e., the sum of predicted passenger flow per ticket type equals the predicted station aggregated passenger flow). Experimental results indicate that in the traditional prediction approach, our IPF-HMGNN can significantly reduce the mean absolute error (MAE) and root mean square error (RMSE) of the GNN prediction model by 49.56% and 53.88%, respectively. In the hierarchical prediction approach, IPF-HMGNN can achieve a maximum reduction of 35.32% in MAE and 36.18% in RMSE, while satisfying the hierarchical constraint.
AI Key Findings
Get AI-generated insights about this paper's methodology, results, significance, and more — seven facets brought into focus.
Impact
Authors
PDF Preview
Citation Network
Current paper (gray), citations (green), references (blue)
Display is limited for performance on very large graphs.
Discussion 0