Summary
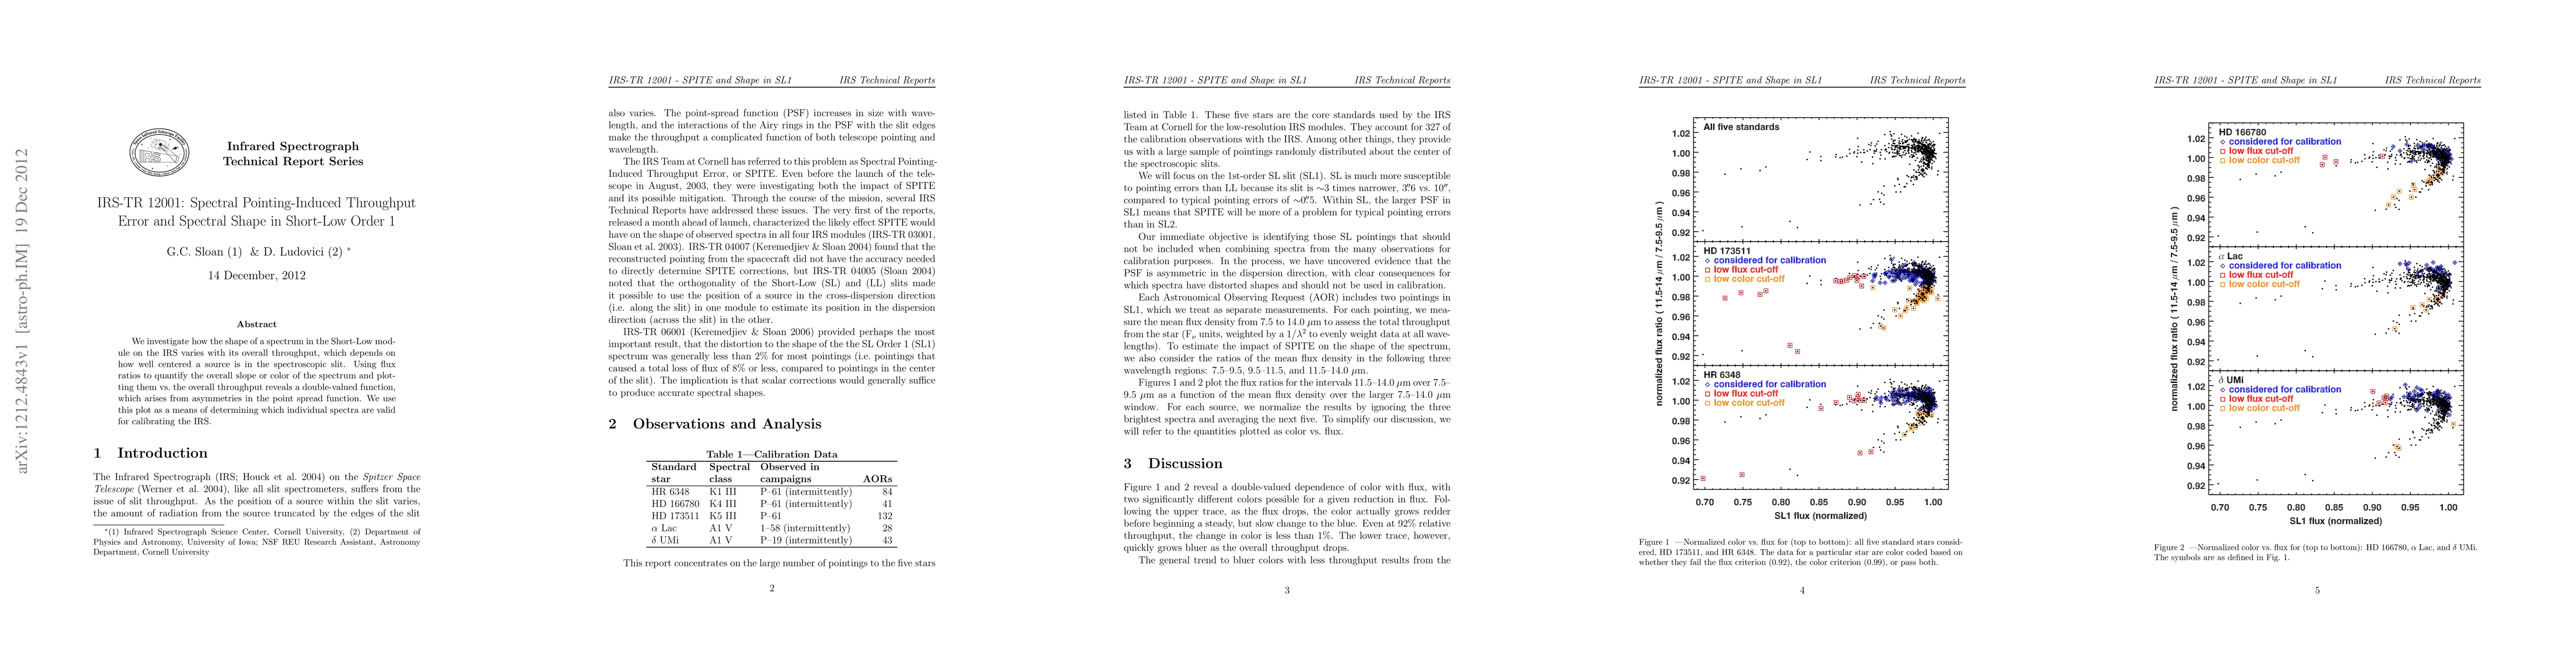
We investigate how the shape of a spectrum in the Short-Low module on the IRS varies with its overall throughput, which depends on how well centered a source is in the spectroscopic slit. Using flux ratios to quantify the overall slope or color of the spectrum and plotting them vs. the overall throughput reveals a double-valued function, which arises from asymmetries in the point spread function. We use this plot as a means of determining which individual spectra are valid for calibrating the IRS.
AI Key Findings
Get AI-generated insights about this paper's methodology, results, and significance.
Paper Details
PDF Preview
Key Terms
throughput
(0.341)
overall
(0.318)
asymmetries
(0.210)
spectrum
(0.204)
vs
(0.200)
centered
(0.196)
slope
(0.186)
varies
(0.181)
Citation Network
Current paper (gray), citations (green), references (blue)
Display is limited for performance on very large graphs.
Current Paper
Citations
References
Click to view
| Title | Authors | Year | Actions |
|---|
Comments (0)