iSLAT: the Interactive Spectral-Line Analysis Tool for JWST and beyond
Publication
Metrics
AI Quick Summary
iSLAT is a Python-based graphical tool for interactively exploring and fitting molecular emission lines in spectra, particularly useful for analyzing data from the James Webb Space Telescope. It allows real-time adjustment of parameters and high-resolution visualization of individual lines, and is available on GitHub.
Paper Preview
Abstract
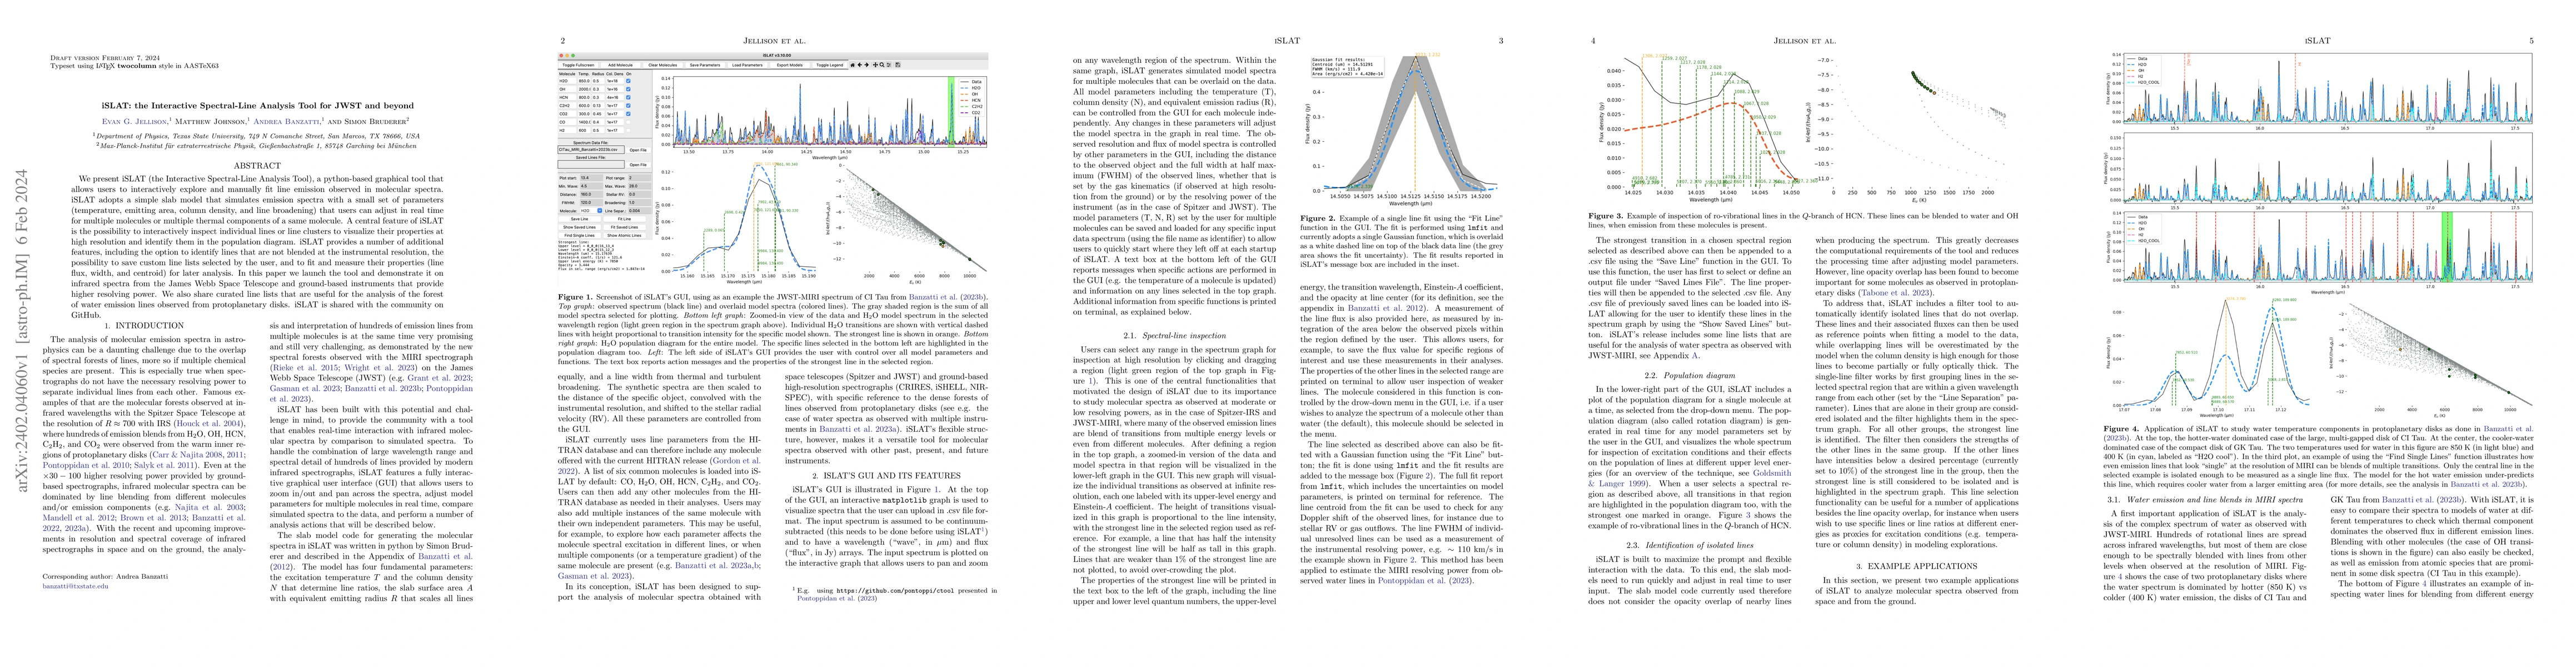
We present iSLAT (the Interactive Spectral-Line Analysis Tool), a python-based graphical tool that allows users to interactively explore and manually fit line emission observed in molecular spectra. iSLAT adopts a simple slab model that simulates emission spectra with a small set of parameters (temperature, emitting area, column density, and line broadening) that users can adjust in real time for multiple molecules or multiple thermal components of a same molecule. A central feature of iSLAT is the possibility to interactively inspect individual lines or line clusters to visualize their properties at high resolution and identify them in the population diagram. iSLAT provides a number of additional features, including the option to identify lines that are not blended at the instrumental resolution, the possibility to save custom line lists selected by the user, and to fit and measure their properties (line flux, width, and centroid) for later analysis. In this paper we launch the tool and demonstrate it on infrared spectra from the James Webb Space Telescope and ground-based instruments that provide higher resolving power. We also share curated line lists that are useful for the analysis of the forest of water emission lines observed from protoplanetary disks. iSLAT is shared with the community on GitHub.
AI Key Findings
Get AI-generated insights about this paper's methodology, results, significance, and more — seven facets brought into focus.
Impact
Paper Details
Authors
PDF Preview
Key Terms
Citation Network
Current paper (gray), citations (green), references (blue)
Display is limited for performance on very large graphs.
Discussion 0