Isotropy Test with Quasars Using Method of Smoothed Residuals
Publication
Metrics
AI Quick Summary
The study uses quasar data to test for large-scale anisotropies, finding a significant underdensity in the southern sky that persists even after correcting for ecliptic bias and anomalous dipole.
Paper Preview
Abstract
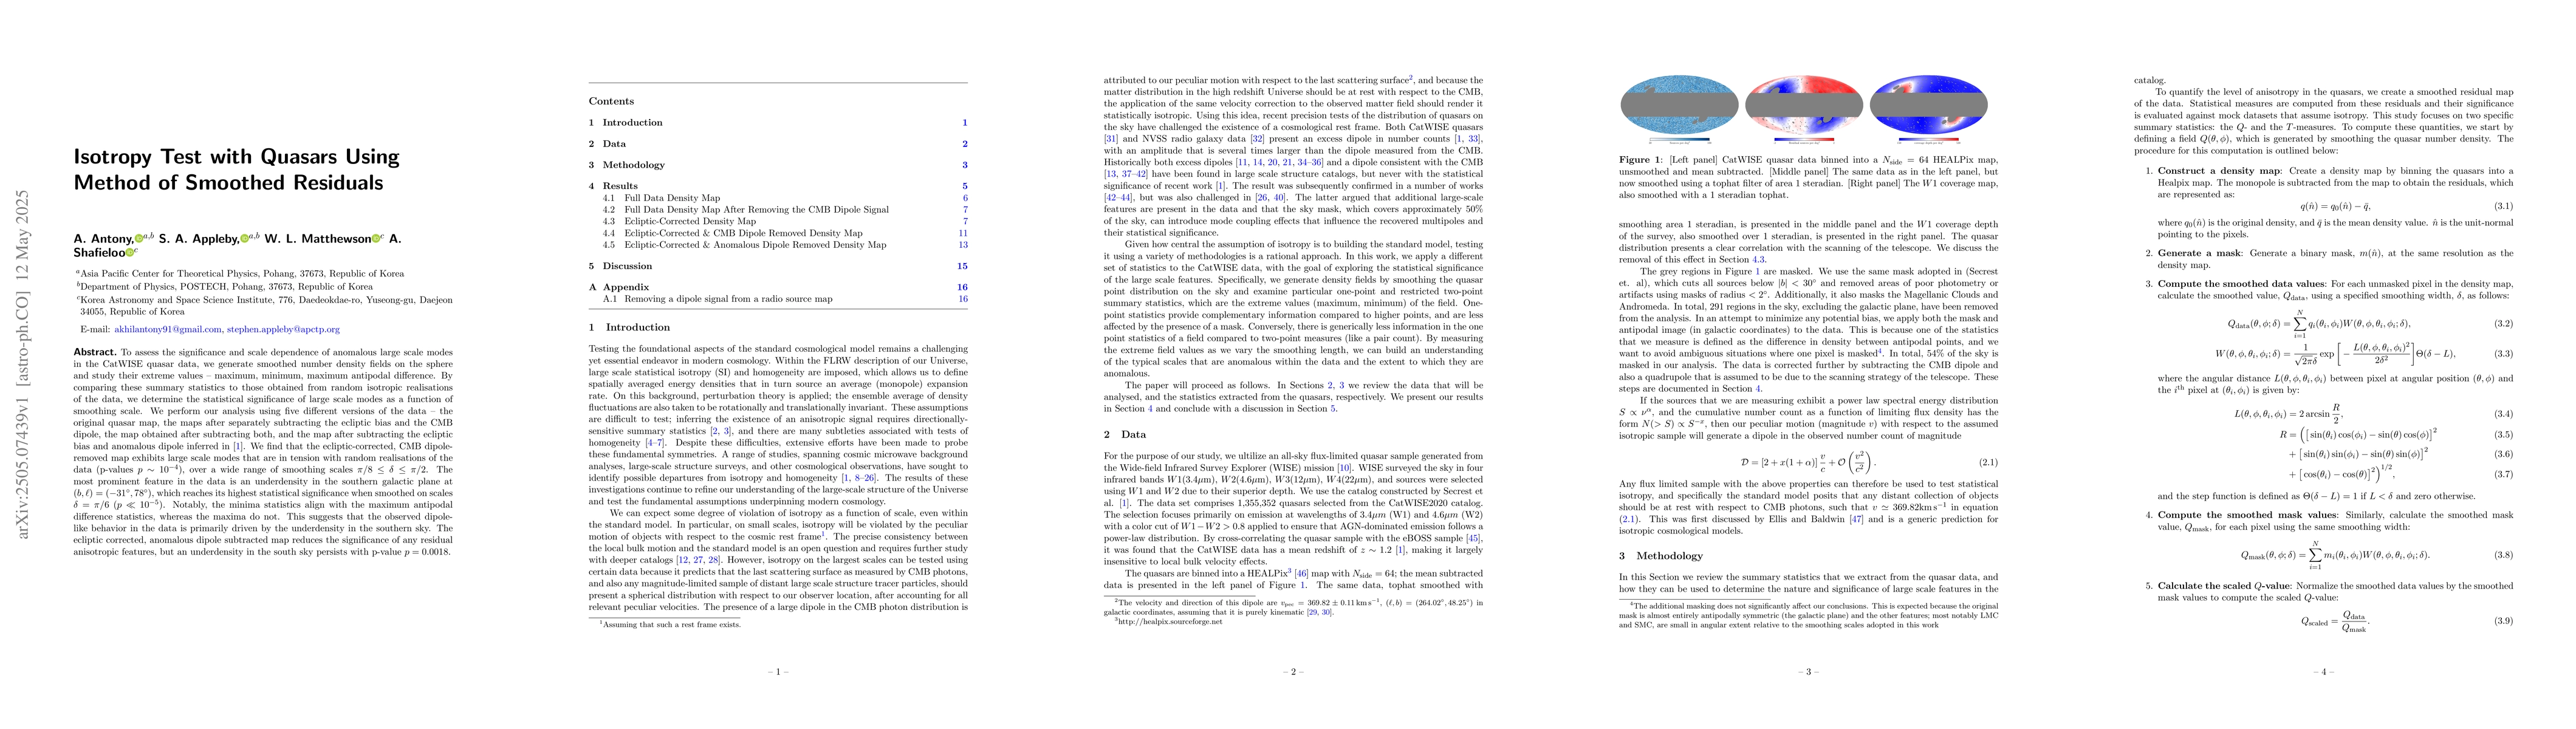
To assess the significance and scale dependence of anomalous large scale modes in the CatWISE quasar data, we generate smoothed number density fields on the sphere and study their extreme values -- maximum, minimum, maximum antipodal difference. By comparing these summary statistics to those obtained from random isotropic realisations of the data, we determine the statistical significance of large scale modes as a function of smoothing scale. We perform our analysis using five different versions of the data -- the original quasar map, the maps after separately subtracting the ecliptic bias and the CMB dipole, the map obtained after subtracting both, and the map after subtracting the ecliptic bias and anomalous dipole inferred in \cite{Secrest2021}. We find that the ecliptic-corrected, CMB dipole-removed map exhibits large scale modes that are in tension with random realisations of the data (p-values $p \sim 10^{-4}$), over a wide range of smoothing scales $\pi/8 \leq \delta \leq \pi/2$. The most prominent feature in the data is an underdensity in the southern galactic plane at $(b,\ell) = (-31^\circ,78^\circ)$, which reaches its highest statistical significance when smoothed on scales $\delta = \pi/6$ ($p \ll 10^{-5}$). Notably, the minima statistics align with the maximum antipodal difference statistics, whereas the maxima do not. This suggests that the observed dipole-like behavior in the data is primarily driven by the underdensity in the southern sky. The ecliptic corrected, anomalous dipole subtracted map reduces the significance of any residual anisotropic features, but an underdensity in the south sky persists with p-value $p =0.0018$.
AI Key Findings
Get AI-generated insights about this paper's methodology, results, significance, and more — seven facets brought into focus.
Impact
Paper Details
Authors
PDF Preview
Citation Network
Current paper (gray), citations (green), references (blue)
Display is limited for performance on very large graphs.
Discussion 0