Jacob's Ladder: The User Implications of Leveraging Graph Pivots
Publication
Metrics
AI Quick Summary
This paper introduces a simple visual technique for extracting subgraphs using pivots and filters, which scales independently of graph complexity. The study reveals how user intent can be ambiguous during pivots, suggesting potential for "smart pivots" that anticipate user needs, and highlighting adaptive data abstractions that reduce reliance on designer-created comprehensive abstractions.
Paper Preview
Abstract
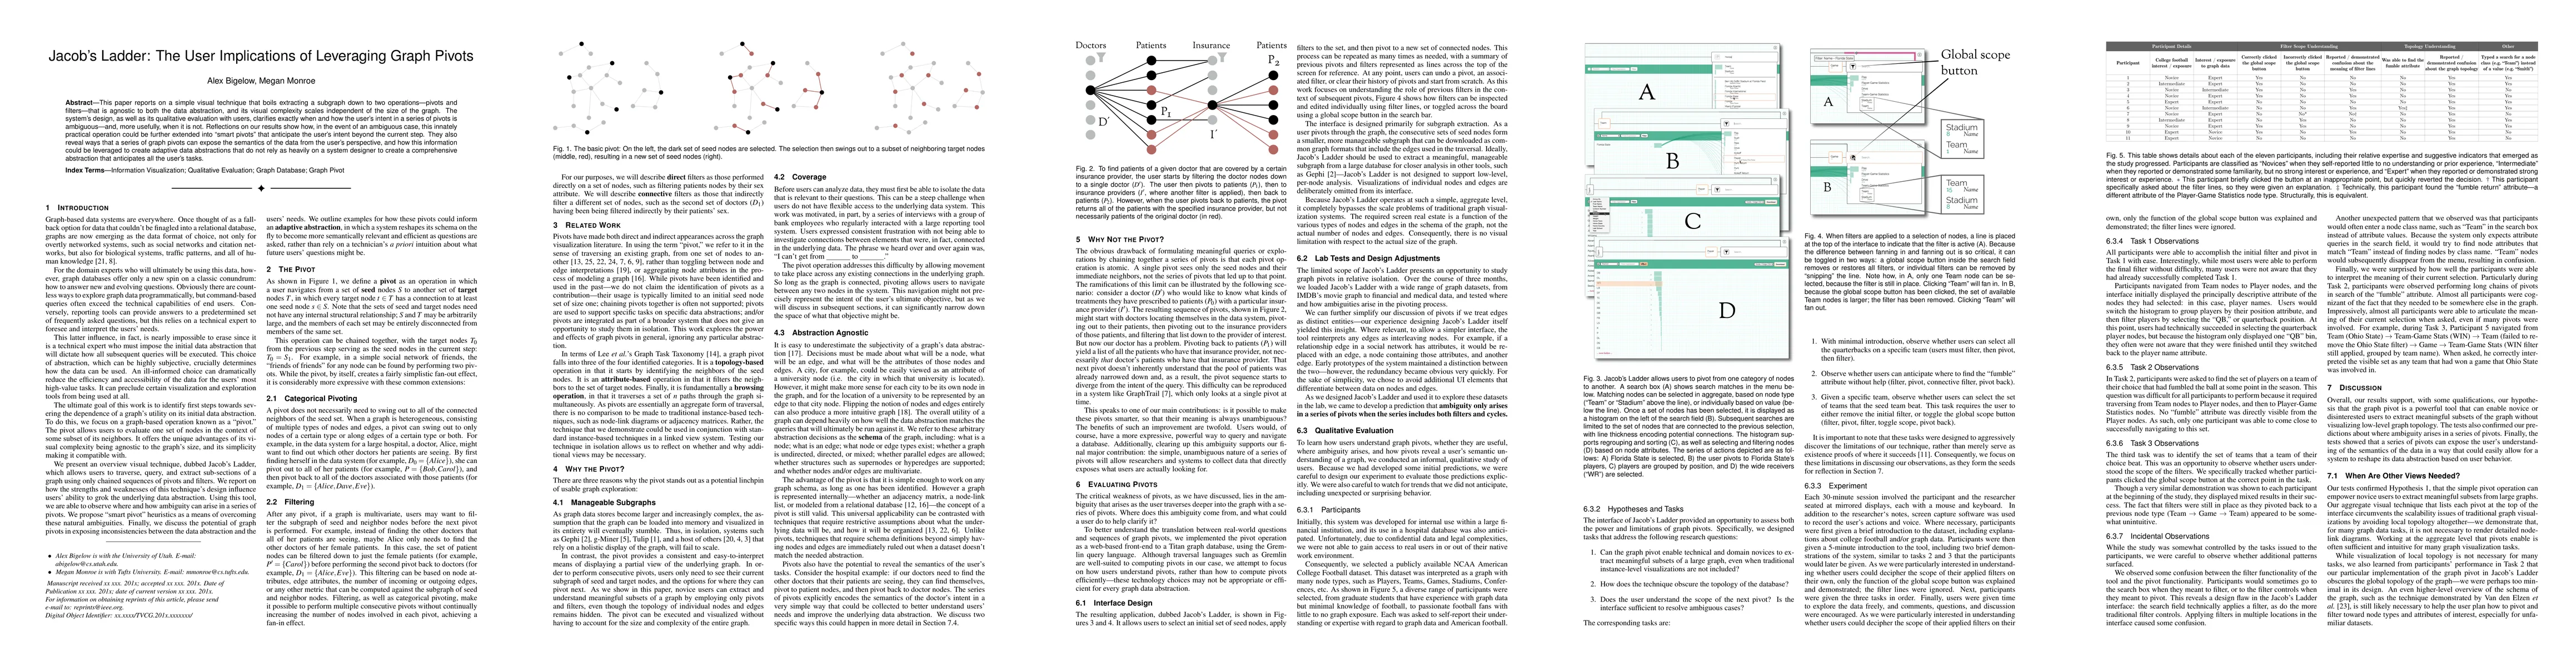
This paper reports on a simple visual technique that boils extracting a subgraph down to two operations---pivots and filters---that is agnostic to both the data abstraction, and its visual complexity scales independent of the size of the graph. The system's design, as well as its qualitative evaluation with users, clarifies exactly when and how the user's intent in a series of pivots is ambiguous---and, more usefully, when it is not. Reflections on our results show how, in the event of an ambiguous case, this innately practical operation could be further extended into "smart pivots" that anticipate the user's intent beyond the current step. They also reveal ways that a series of graph pivots can expose the semantics of the data from the user's perspective, and how this information could be leveraged to create adaptive data abstractions that do not rely as heavily on a system designer to create a comprehensive abstraction that anticipates all the user's tasks.
AI Key Findings
Get AI-generated insights about this paper's methodology, results, significance, and more — seven facets brought into focus.
Impact
Paper Details
PDF Preview
Key Terms
Citation Network
Current paper (gray), citations (green), references (blue)
Display is limited for performance on very large graphs.
Discussion 0