Publication
Metrics
AI Quick Summary
This paper explores the use of multivariate topological visualization techniques, specifically the joint contour net, to analyze lattice QCD data and predict phase transitions in QCD matter. The study aims to enhance the interpretation of complex simulation data, despite the challenges posed by quantum mechanics.
Paper Preview
Abstract
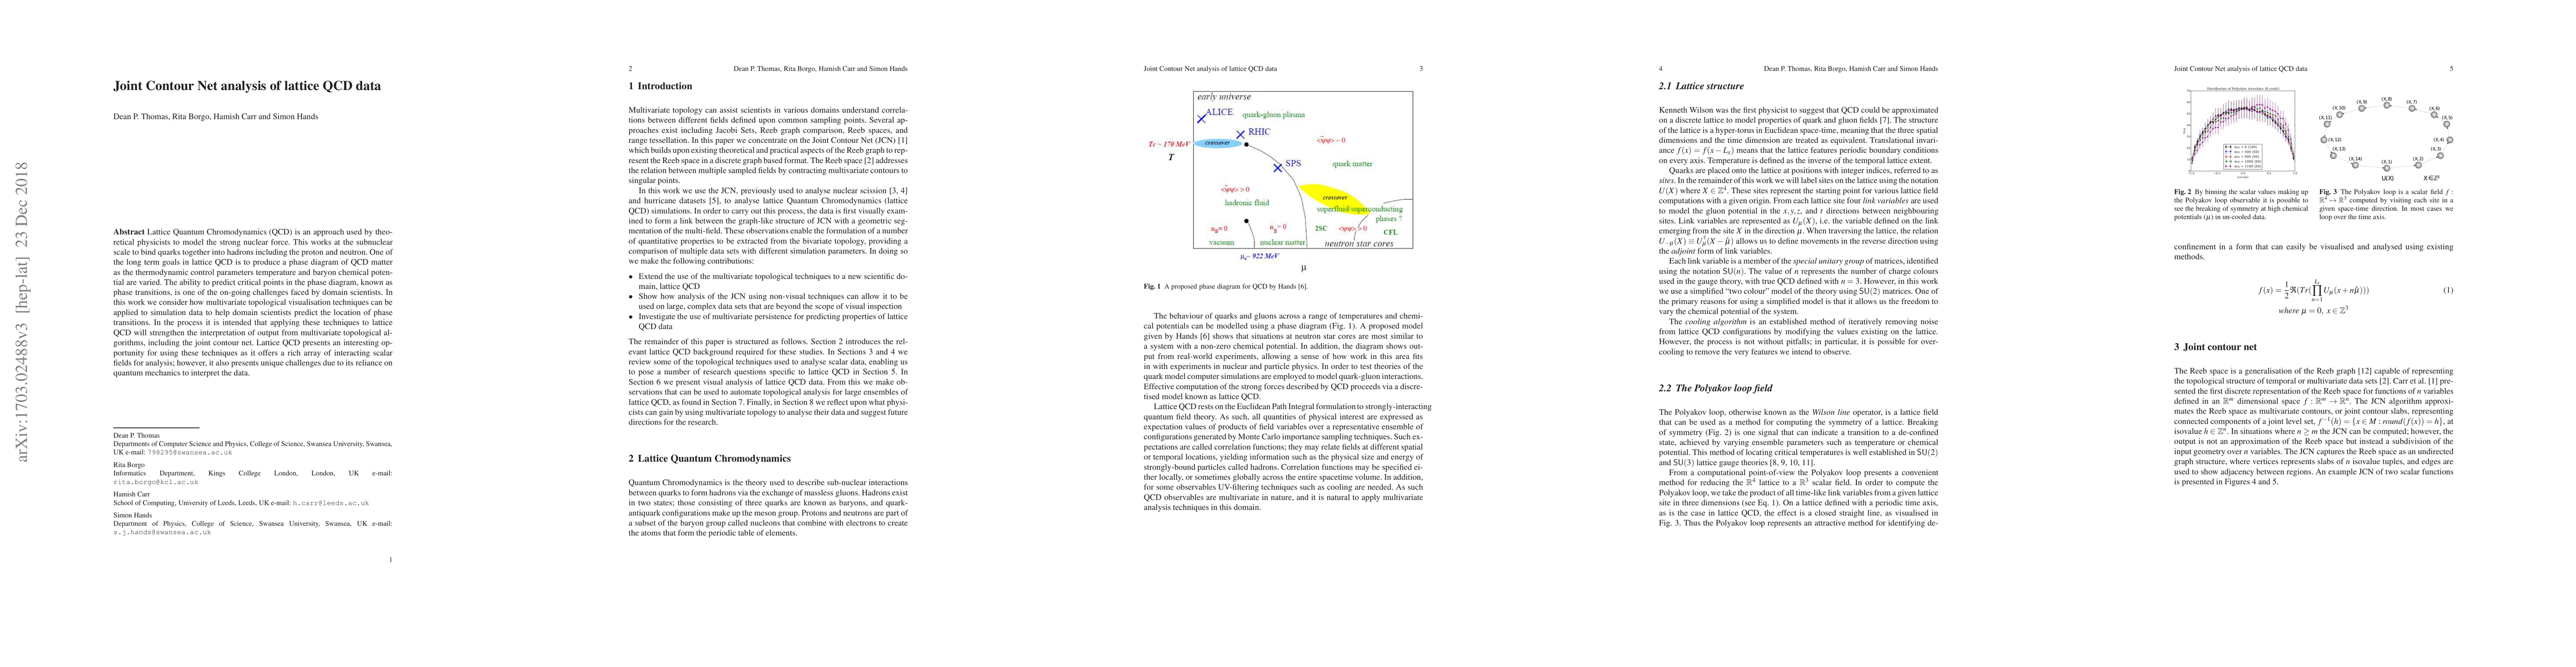
Lattice Quantum Chromodynamics (QCD) is an approach used by theoretical physicists to model the strong nuclear force. This works at the sub-nuclear scale to bind quarks together into hadrons including the proton and neutron. One of the long term goals in lattice QCD is to produce a phase diagram of QCD matter as thermodynamic control parameters temperature and baryon chemical potential are varied. The ability to predict critical points in the phase diagram, known as phase transitions, is one of the on-going challenges faced by domain scientists. In this work we consider how multivariate topological visualisation techniques can be applied to simulation data to help domain scientists predict the location of phase transitions. In the process it is intended that applying these techniques to lattice QCD will strengthen the interpretation of output from multivariate topological algorithms, including the joint contour net. Lattice QCD presents an interesting opportunity for using these techniques as it offers a rich array of interacting scalar fields for analysis; however, it also presents unique challenges due to its reliance on quantum mechanics to interpret the data.
AI Key Findings
Get AI-generated insights about this paper's methodology, results, significance, and more — seven facets brought into focus.
Impact
Paper Details
PDF Preview
Key Terms
Citation Network
Current paper (gray), citations (green), references (blue)
Display is limited for performance on very large graphs.
Discussion 0