This paper proposes a novel method to estimate multiple dependent Gaussian graphical models, which can handle cross-dependence among variables in complex datasets like gene expression data from different tissues. The proposed graphical EM technique outperforms a simple one-step method and yields biologically plausible results in mouse genomics applications.
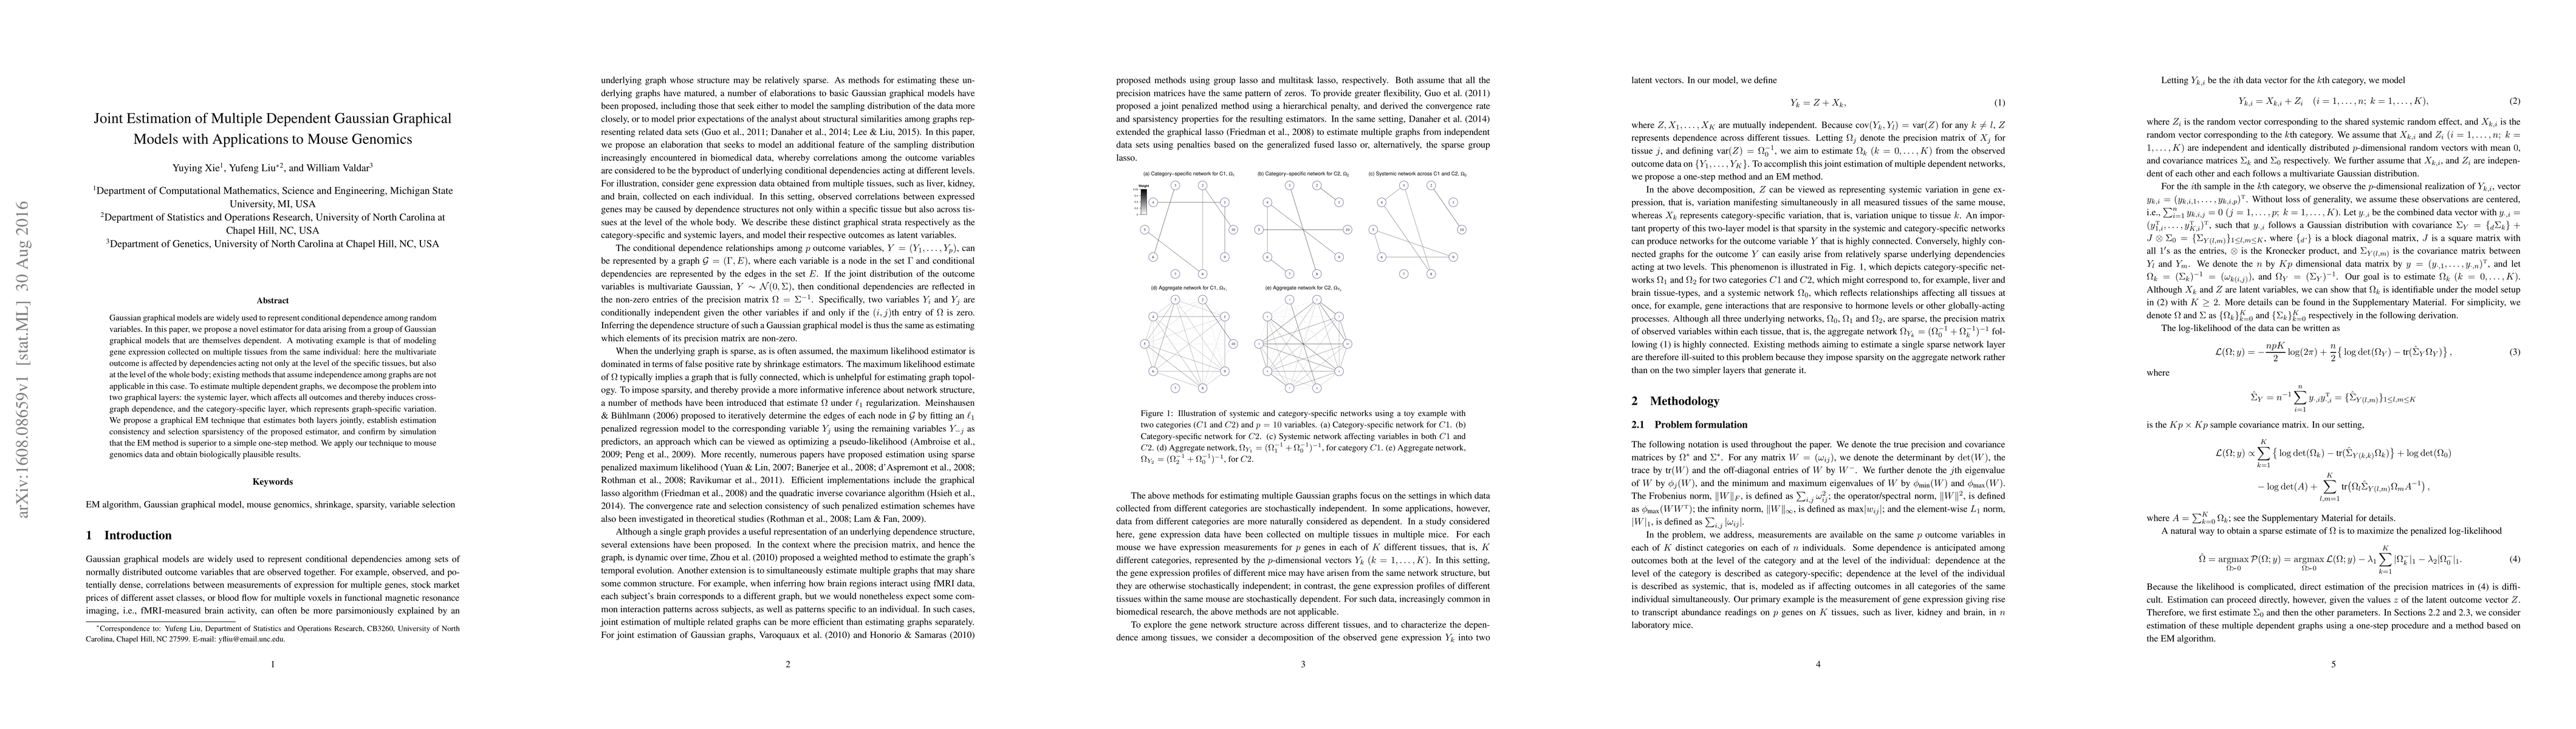
Gaussian graphical models are widely used to represent conditional dependence among random variables. In this paper, we propose a novel estimator for data arising from a group of Gaussian graphical models that are themselves dependent. A motivating example is that of modeling gene expression collected on multiple tissues from the same individual: here the multivariate outcome is affected by dependencies acting not only at the level of the specific tissues, but also at the level of the whole body; existing methods that assume independence among graphs are not applicable in this case. To estimate multiple dependent graphs, we decompose the problem into two graphical layers: the systemic layer, which affects all outcomes and thereby induces cross- graph dependence, and the category-specific layer, which represents graph-specific variation. We propose a graphical EM technique that estimates both layers jointly, establish estimation consistency and selection sparsistency of the proposed estimator, and confirm by simulation that the EM method is superior to a simple one-step method. We apply our technique to mouse genomics data and obtain biologically plausible results.
Get AI-generated insights about this paper's methodology, results, and significance.
Current paper (gray), citations (green), references (blue)
Title | Authors | Year | Actions |
---|---|---|---|
Sparse inference of the human haematopoietic system from heterogeneous and partially observed genomic data
|
G. Sottile, L. Augugliaro, Veronica Vinciotti, Walter Arancio, C. Coronnello
|
2024
|
View Paper |
Multi-channel anomaly detection using graphical models
|
Bernadin Namoano, Christina Latsou, J. Erkoyuncu
|
2024
|
View Paper |
SIRT2 overexpression decreases remifentanil-stimulated post-surgical hyperalgesia via microglia.
|
Wei Zhu, Zhengliang Ma
|
2023
|
View Paper |
Estimation of Graphical Models: An Overview of Selected Topics
|
Li‐Pang Chen
|
2023
|
View Paper |
On the application of Gaussian graphical models to paired data problems
|
Saverio Ranciati, A. Roverato
|
2023
|
View Paper |
Exploration of the search space of Gaussian graphical models for paired data
|
A. Roverato, Dung Ngoc Nguyen
|
2023
|
View Paper |
Bayesian Covariate-Dependent Gaussian Graphical Models with Varying Structure
|
Yang Ni, F. Stingo, V. Baladandayuthapani, Qi Liu
|
2022
|
View Paper |
Copula Graphical Models for Heterogeneous Mixed Data
|
Sjoerd Hermes, J. Heerwaarden, Pariya Behrouzi
|
2022
|
View Paper |
Comparing Dependent Undirected Gaussian Networks
|
Hongmei Zhang, Xianzheng Huang, H. Arshad
|
2022
|
View Paper |
Prioritizing Autism Risk Genes Using Personalized Graphical Models Estimated From Single-Cell RNA-seq Data
|
Jianyu Liu, Haodong Wang, Wei Sun, Yufeng Liu
|
2021
|
View Paper |
Where Do We Stand in Regularization for Life Science Studies?
|
Veronica Tozzo, Chloé-Agathe Azencott, Samuele Fiorini, E. Fava, A. Trucco, A. Barla
|
2021
|
View Paper |
HB-PLS: A statistical method for identifying biological process or pathway regulators by integrating Huber loss and Berhu penalty with partial least squares regression
|
Wenping Deng, Kui Zhang, Cheng He, Sanzhen Liu, Hairong Wei
|
2021
|
View Paper |
Bayesian Causal Inference in Probit Graphical Models
|
F. Castelletti, G. Consonni
|
2020
|
View Paper |
HB-PLS: An algorithm for identifying biological process or pathway regulators by integrating Huber loss and Berhu penalty with partial least squares regression
|
Wenping Deng, Kui Zhang, Zhigang Wei, Lihu Wang, Cheng He, Sanzhen Liu, Hairong Wei
|
2020
|
View Paper |
MOTA: Network-Based Multi-Omic Data Integration for Biomarker Discovery
|
Ziling Fan, Yuan Zhou, H. Ressom
|
2020
|
View Paper |
Joint reconstruction of multiple gene networks by simultaneously capturing inter-tumor and intra-tumor heterogeneity
|
Jia-Juan Tu, Ou-Yang Le, Hong Yan, Xiao-Fei Zhang, Hong Qin
|
2020
|
View Paper |
SIN-KNO: A method of gene regulatory network inference using single-cell transcription and gene knockout data
|
Huiqing Wang, Yuanyuan Lian, Chun Li, Yue Ma, Zhiliang Yan, Chunlin Dong
|
2019
|
View Paper |
Netboost: Boosting-Supported Network Analysis Improves High-Dimensional Omics Prediction in Acute Myeloid Leukemia and Huntington’s Disease
|
P. Schlosser, J. Knaus, Maximilian Schmutz, K. Döhner, C. Plass, L. Bullinger, R. Claus, H. Binder, M. Lübbert, M. Schumacher
|
2019
|
View Paper |
Fast hybrid Bayesian integrative learning of multiple gene regulatory networks for type 1 diabetes.
|
B. Jia, F. Liang
|
2019
|
View Paper |
Computational methods for Gene Regulatory Networks reconstruction and analysis: A review
|
F. Delgado-Chaves, Francisco Gómez-Vela
|
2019
|
View Paper |
A Min‐Max conditional covariance algorithm for structure learning of Gaussian graphical models
|
Wei Gao, Wenna Ye
|
2018
|
View Paper |
Fast Bayesian Integrative Learning of Multiple Gene Regulatory Networks for Type 1 Diabetes
|
B. Jia, F. Liang, T. S. Group
|
2018
|
View Paper |
Joint Estimation and Inference for Data Integration Problems based on Multiple Multi-layered Gaussian Graphical Models
|
S. Majumdar, G. Michailidis
|
2018
|
View Paper |
Overexpression of SIRT2 Alleviates Neuropathic Pain and Neuroinflammation Through Deacetylation of Transcription Factor Nuclear Factor-Kappa B
|
Yong Zhang, Dachao Chi
|
2017
|
View Paper |
7 D ec 2 01 8 Fast Bayesian Integrative Learning of Multiple Gene Regulatory Networks for Type 1 Diabetes
|
B. Jia, F. Liang
|
2018
|
View Paper |
ALGORITHMS FOR RECONSTRUCTION OF GENE REGULATORY NETWORKS FROM HIGH -THROUGHPUT GENE EXPRESSION DATA
|
Wenping Deng
|
2018
|
View Paper |
Comments (0)